
How I Leverage AI to Customise My Charts
Case study: conditional formatting based on ATR multiples from the 50 DMA

Inspiration needn’t come from legends.
Many ‘regular’ people also have inspiring stories to tell, if we just care to look, ask curiosity-driven questions, and truly listen to the answers.
This belief drove the recent series of reader stories in celebration of TTRH’s second anniversary.
Some readers’ journeys began over two decades ago.
Others began more recently, yet have already made great strides and even inspired others — such as Daniel Marks, who didn’t just inspire several readers to experiment with a simple algorithm, but inspired me to experiment with Grok to code some custom indicators.
As it turns out, Grok and TC2000 combine well — if you know what you’re looking for.
Grok can write TC2000 formulas with accuracy.
But its power is wholly dependent on whether you actually know what you want to see!
AI won’t think for you. (Or will return mediocre results if you do outsource the thinking.) Plus, you may well need to tweak its outputs.
So, be clear on your edge.
(Important outside the context of AI, too. If you aren’t clear on your edge, the market will constantly be ‘advertising’ to you. Everything that vaguely looks like a setup will seem like a potential opportunity — leading to overtrading.)
THE IDEA: DISPLAY ATR MULTIPLES FROM THE 50 DMA
For example, I know I improve my odds by not buying stocks overly extended from their 50-day moving average (DMA).
Thanks to this Jeff Sun-inspired stack from December 2024 — or rather, studying the concepts, in depth, as I wrote that stack — I finally understood the importance of selling partials into strength.
This isn’t a cop-out, but a tool for keeping your equity curve smooth and all the associated psychological benefits.
As a TC2000 user, I can’t add Jeff’s 10x average true range (ATR) indicator to my charts directly. But I can add conditional formatting, which is particularly valuable when using OHLC bars rather than candlesticks.
(I was already using OHLC bars on intraday charts, but used candles on daily and weekly charts.)
So, I switched to OHLC bars on all timeframes, and coloured bars on the daily chart based on ATR multiples from the 50 DMA.
This is what my current chart layout looks like:
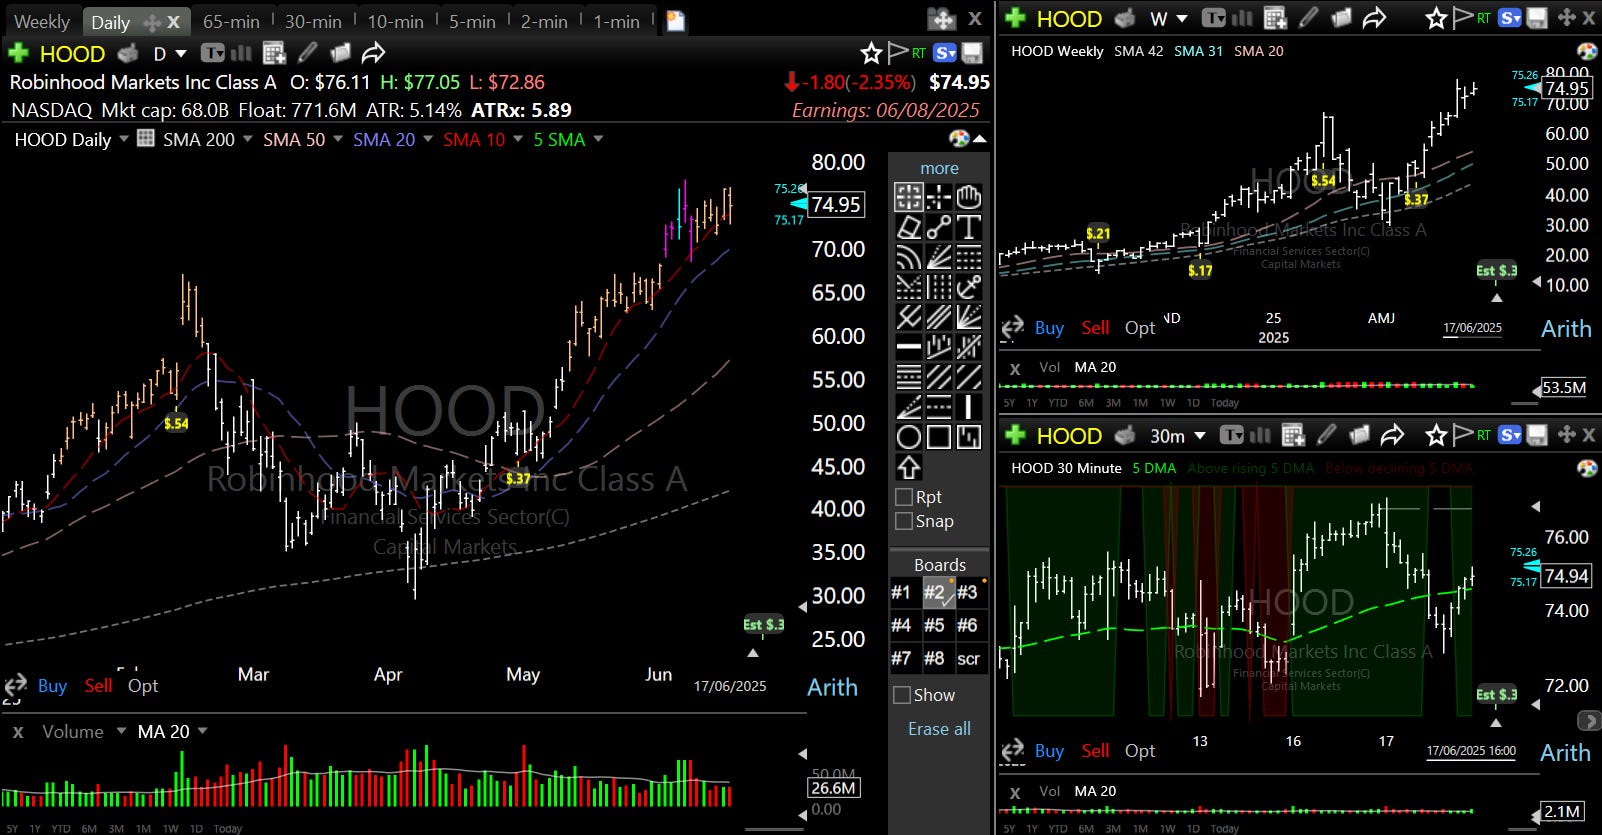
Orange bars warn me a stock is between 4–7.5x ATR from its 50 DMA — not the time to take a new position.
Pink bars indicate the stock is between 7.5–10x ATR from its 50 DMA, and that I need to start thinking about selling a partial.
Blue bars tell me the stock is ≥10x ATR from its 50 DMA, and that I must sell at least some of my position. Depending on my recent portfolio and watchlist performance, I may get out of the stock completely.
In the toolbar above the daily chart, I can also see the exact ATR extension from the 50 DMA (I’ve called it “ATRx”).
MY PROCESS
Here’s how I set up conditional formatting based on ATRx in TC2000:
Please don’t copy this blindly. I’m sharing my process and lessons so you can adapt them to fit your trading style and personality. Most notably, significant ATRx values (i.e. threshold values) vary per trader.
First, I got Grok 3 to supply my starting point, prompting it with the language from Jeff’s 10x ATR indicator:
A = ATR% = $ ATR / $ Last Done Price
B = % Gain From 50-MA
B / A = ATR% multiple from 50-MA
Here’s what Grok 3 returned:
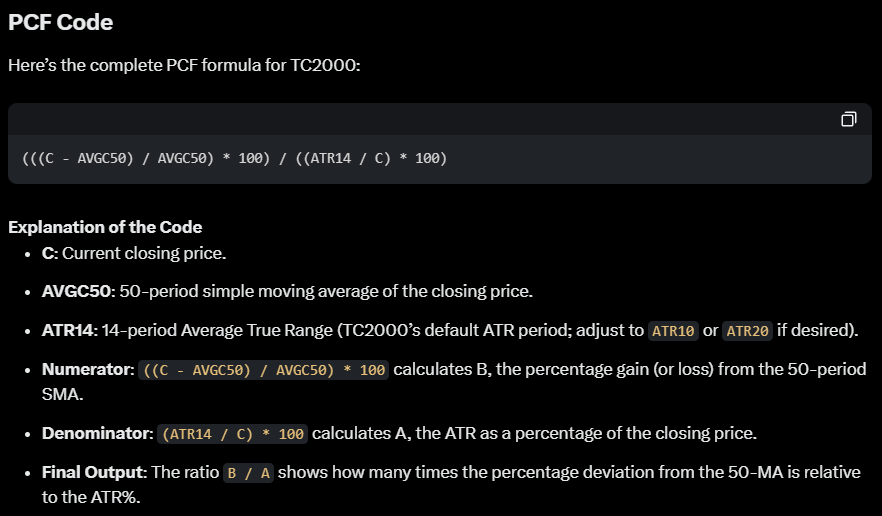
I now use this formula in TC2000:
(((H - AVGC50) / AVGC50) * 100) / ((ATR14 / AVGC14) * 100) >= 10To explain my changes from Grok’s output:
I added “>= 10” at the end to turn it into a Boolean formula — specifically, to return a true/false value for whether the stock is at least 10 ATRx.
I changed the second “C” to “AVGC14”, as this aligns closer to Jeff’s TradingView indicator (H/T @aperiwal93).
I changed the first “C” to “H” (i.e. from the current/closing price to the highest point of the bar), so I can see whether the stock had crossed 10 ATRx at any point during the day. Particularly when studying chart history, I want to know when the sell signal flashed intraday, then closed <10 ATRx (as well as when it held the 10 ATRx extension into the close).
For the pink and orange bars, I use these formulas:
(((C - AVGC50) / AVGC50) * 100) / ((ATR14 / AVGC14) * 100) >= 7.5(((C - AVGC50) / AVGC50) * 100) / ((ATR14 / AVGC14) * 100) >= 4For these, I kept the first “C”, so this conditional formatting is based on current or closing price.
I also use “C” in the formula in my toolbar:
(((C - AVGC50) / AVGC50) * 100) / ((ATR14 / AVGC14) * 100)Finally, order the formulas from largest to smallest ATRx, so TC2000 prioritises the colours correctly:
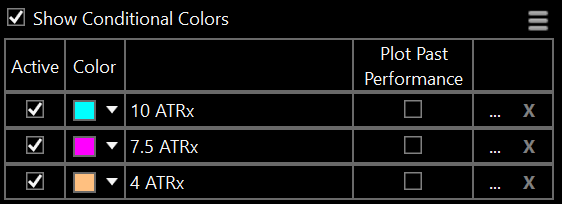
I used the same broad process for all other customised indicators/formatting in my TC2000 layout, including some scan criteria, and the colours on my intraday charts based on the rising/declining 5 DMA and its position relative to price.
However, as I’m still actively playing around with these, I’ll share those another time (if there’s interest).
MY KEY LESSONS
1. Keep an open mind around AI.
While outsourcing the thinking is asking for trouble, AI offers value around idea execution.
2. Trades can work when the ATR is extended from the 50 DMA…
…but the potential risk–reward is far better when you keep an eye on the ATRx.
Same thing when selling into strength: the ATRx isn’t perfect, but then nor is trading — which is why successful traders think in probabilities.
Stack the odds in your favour.
3. Don’t underestimate the power of your environment.
Who you spend your time with, and consume content from, hugely impact your energy, beliefs and creativity — in both directions.
Curate your environment with care.
Hope this helps!
See you next week,
Kyna
P.S. How do you like this shorter stack style? Let me know in the comments!
How did you find the threshold values and where did this idea come from? Hours of deep diving? Great insight! I always enjoy to read how others think about the market and which strategy or idea works for them. :)
I love this, the bars are a little bit too much for me but love the idea of having the extension in the toolbar. The only problem I am having is actually saving the formula as a PCF and then getting it added. Its great how we can use AI to work on TC2000, I used it to help me to add a cloud area around the 20 day EMA to stop me thinking in absolutes when it comes to MA's.
Thank you for all your work.