
How to Allocate Risk More Effectively
Tom Dante notes: stop moaning and start improving (part 3)

Different trades have different expectancies, so you shouldn’t risk the same amount on each trade.
Those different expectancies might come from trading multiple strategies or setups. After all, not all edges are created equal.
When in an easy dollar environment, you also want to be risking more than in a hard penny environment. Particularly for trend followers, situational awareness matters.
You may also trade better — or worse — depending on the time of day or day of the week. Or, if you’ve traded long enough, you might have a month you consistently perform badly in. Seasonality does play a role.
Whatever your variables, it’s important to be aware of them. Know when the odds are on your side. Know your expectancies. Then, allocate your risk (i.e. position size) accordingly.
This stack suggests a few variables for you to look at. It also outlines some simple Excel techniques that can help you with your analysis.
About my notes
This is part 3 of my notes on “Stop Moaning and Start Improving (Part 2)” by Tom Dante.
Even though I trade different markets and strategies to Tom, this video’s had the biggest, enduring impact on me as a trader to date. I explain why in detail in part 1 of this series.
But to tell the short version: not only did it get me to journal consistently, it also showed me how I could analyse it effectively. This helped me identify my strengths and develop conviction.
Today’s notes cover:
Tom’s suggestions from this video on effective risk allocation;
A few suggestions of my own; and
My own Excel techniques to help you look into those suggestions. (As I’m not an Excel wizard, these are really simple techniques anyone can learn. No macros, I promise.)
Trading different strategies or setups
Do some strategies or setups work better for you than others (20:03)? If so, it makes a lot of sense for you to put more money to work in the strategies that you perform better in. You want to risk more where your odds are better.
You should already have a pretty good idea of which setups make you money, and which don’t. But if you’re unsure, let’s explore a way of how you can look into this in Excel.
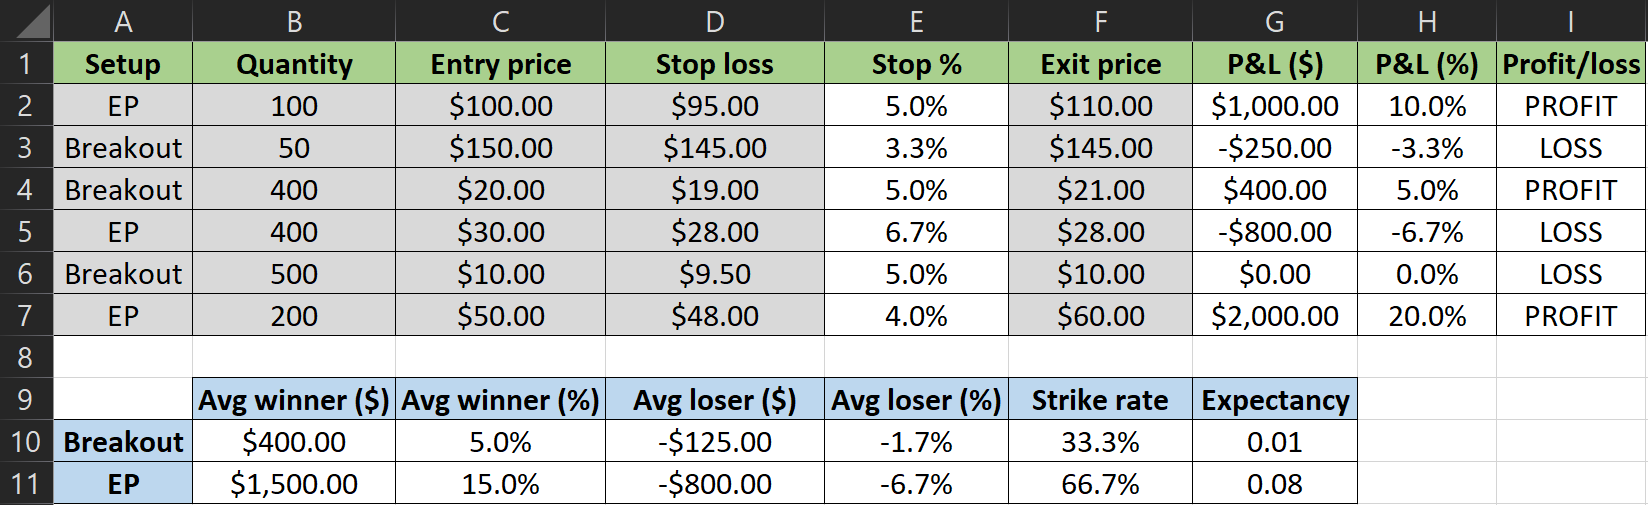
The above screenshot is based on random data — this isn’t mine, or anyone else’s, journal. It’s just to illustrate how you can work out your expectancies for different strategies or setups in Excel.
Basic data
You should already be collecting data like the one in table A1:I7. But just in case you’re not: the grey cells are inputted manually, and the white cells use the following formulas:
E2: =IF(D2="","",(C2-D2)/C2)
G2: =IF(F2="","",(F2-C2)*B2)
H2: =IF(G2="","",G2/(B2*C2))
I2: =IF(G2="","",IF(G2>0,"PROFIT","LOSS"))
Then copy and paste these to the remaining rows.
Analysis by strategy or setup
Now for the fun part.
List on the Y axis (i.e. for each row) your setups, spelled exactly the same way as in your trade log. (Otherwise, the formulas below won’t work.)
Then, to replicate the data as in table A9:G11 in the screenshot above (though you may want to collect slightly different information — key is that it answers your question: how do I allocate risk effectively per strategy/setup?):
B10: =AVERAGEIFS($G$2:$G$7,$A$2:$A$7,A10,$I$2:$I$7,"PROFIT")
C10: =AVERAGEIFS($H$2:$H$7,$A$2:$A$7,A10,$I$2:$I$7,"PROFIT")
D10: =AVERAGEIFS($G$2:$G$7,$A$2:$A$7,A10,$I$2:$I$7,"LOSS")
E10: =AVERAGEIFS($H$2:$H$7,$A$2:$A$7,A10,$I$2:$I$7,"LOSS")
F10: =COUNTIFS($A$2:$A$7,A10,$I$2:$I$7,"PROFIT")/COUNTIFS($A$2:$A$7,A10)
G10: =C10*F10+E10*(1-F10)
Then copy and paste these to the remaining row(s).
Example conclusion
Again, the above screenshot isn’t anyone’s real journal. Even if it were, it’s a bit sparse on data — as ever, the bigger your sample size, the more significant your results.
However…
Taking table A9:G11 at face value, it’s pretty obvious that although this person has an edge (positive expectancy) in both their setups, they are far more profitable in EPs than in breakouts — an 8x higher expectancy, to be exact. That’s a pretty strong signal.
With that in mind, they should clearly be putting more money to work in EPs than in breakouts. Depending on their lifestyle, they may even wish to concentrate on EPs alone.
But what definitely does not make sense is to risk the same for both setups.
N.B. Make sure that, following your initial analysis, you continue to monitor this data to ensure you’re maintaining your edge. If you see a major change, that may signify a change in the market. Or maybe it’s due to changing something in the way you trade. Either way, you need to figure out the reason for the change and, if necessary, adjust your position sizing/stock selection processes accordingly.
Varying position sizes
Speaking of position sizing, Tom also suggests levelling out the position sizes on your past trades (based on a fixed % of account risk), and see how what effect that has on your results.
He makes this suggestion because he’s found many traders to be, in essence, randomly varying their size, based on gut instinct alone.
I realise that may appear at odds with the progressive exposure concept that is so important to trend followers. Which is why I want to make the following points:
Tom’s suggestion is predominantly aimed at the people that vary their size based on gut instinct alone, so without real rhyme or reason. He’s not focusing on the traders that vary their size based on a fixed system with clear rules, or based on the expectancy of the strategy in play.
Even if you vary your size in line with hard rules you’ve set for yourself, it’s still to your benefit to see how your results would change if you didn’t vary your size:
If you find that your overall P&L would have been lower, you’ve just confirmed to yourself that your rules are working for you, which will only add to your conviction in them.
But if not varying your size would have improved your P&L, you’re obviously doing something wrong — probably not practising progressive exposure very well, if you’re a trend follower. Whatever the issue, it’s something you need to figure out the root cause of and resolve.
Checking this in Excel
As is so often the case with Excel, there are many ways of achieving the same thing. Working on the assumption that you want me to keep this as simple as possible, and using the same journal (with random trades) as before, you could try the following:
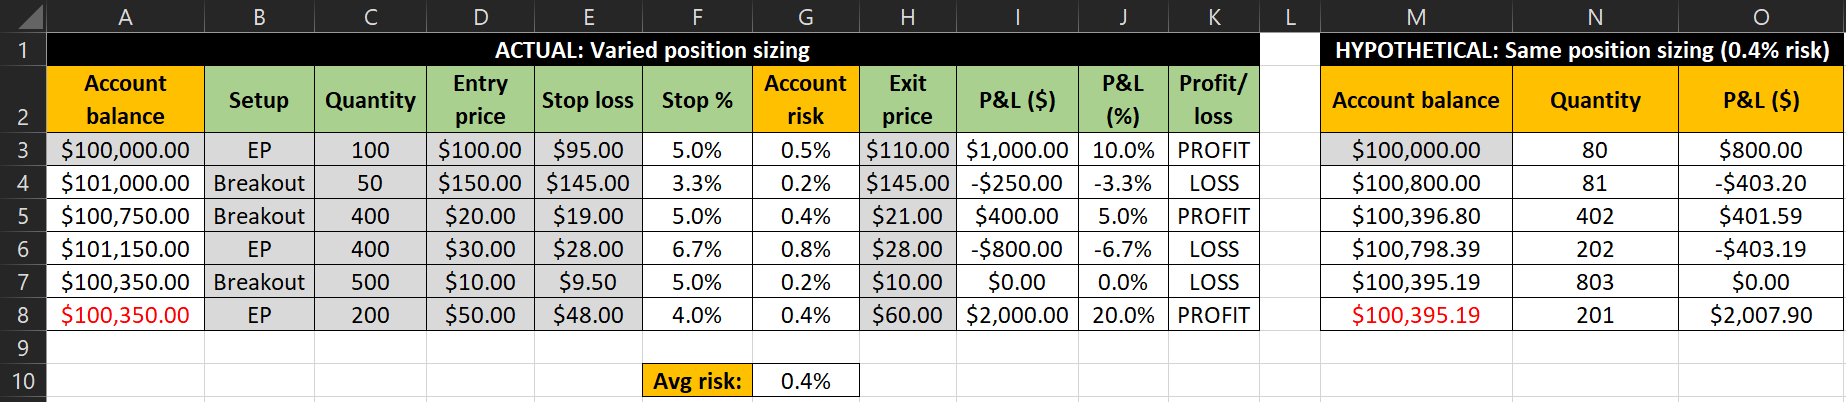
Note the two new columns for the ‘actual’ trades:
Column A/account balance. Manually input A3, use =IF(H3="","",A3+I3) for A4, then copy and paste that to the remaining rows.
Column G/account risk. Use =IF(E3="","",(D3-E3)*C3/A3) for G3, then copy and paste it to the remaining rows.
To keep the comparison as fair as possible, work out your average risk, as I did in G10, using the formula =AVERAGE(G3:G8).
Then, for the hypothetical trades that are all taken at the same % of account risk (your average risk), work out the updated share numbers (column N), with the following formula in N3: =0.4%*M3/F3/D3. (Replace “0.4%” with your average risk.) Then copy and paste that formula to the remaining rows.
Next, update your hypothetical $ P&L (column O), using =(H3-D3)*N3 in O3, then copying that formula to the remaining rows. Also calculate the impact on your account balance: manually input your starting balance in M3, then use =M3+O3 in M4 and copy it to the remaining rows.
Finally, compare your closing account balances of your actual and hypothetical trades (A8 and M8, in red, in the screenshot above).
Drawing your conclusions
In this example, the trader would have been better off taking all trades at the same % risk. Admittedly, the difference is marginal, but then the sample size isn’t very large. Again, the larger your sample size, the more reliable your results.
If you get a result like this, you could proceed taking all trades at the same % risk, or you can delve deeper into your risk allocation and/or progressive exposure rules. What is it about them that makes them inefficient? How can you improve them?
I do advise simplicity where possible, but at the end of the day, you need an edge. And the bigger, the better. To balance the two, I think that checking your expectancies on different strategies/setups, then having hard position sizing rules (based on % account risk), is a good approach.
Whatever you choose to do, just make sure it works for — and makes sense to — you.
Performance under different time variables
Another thing that is worth checking is how you perform under different time variables (22:42), so:
Time of day;
Day of the week; and
Month.
As Tom pointed out, you need to take a holiday at some point, so you may as well figure out what time of year you typically do badly anyway. Take advantage of seasonality!
Similarly, knowing what time of day, or day of week, you trade especially well or badly can help you develop and stick to a routine.
As someone with a day job, but able to work flexible hours, I’ve certainly found it helpful to know when to avoid scheduling meetings — between 13:00 and 16:00 local (UK) time. I also like to get an early start with my day job, to get most of my really focused work done before I start looking at the pre-market.
There may also be specific days of the week you trade particularly well, or badly. This year, I personally have done really well Thursdays but badly on Wednesdays. I take this into account in my trading plans — I’m very, very selective Wednesdays. I also keep that information in mind when scheduling meetings (or other appointments), which I try to book for Wednesdays and avoid on Thursdays. That said, in hard penny environments, cash remains king — I use my ‘day of week’ data to my advantage, but it doesn’t override my situational awareness.
Nevertheless, I think these examples illustrate ways in which having a day job, particularly a flexible one, can actually improve your trading performance. If you know when you perform badly — be it specific times of day, specific days of the week, or both — then you can try to make sure you’re too busy during those periods to place poor trades.
If you really struggle with indiscipline, this can be quite a practical solution for you. First, however, you must know your own statistics. It’s no good for you to just know mine. So let’s dive into some more Excel techniques.
Different times of day
Using the same (random) data as before, I’ve added a few new columns on entry dates and times:
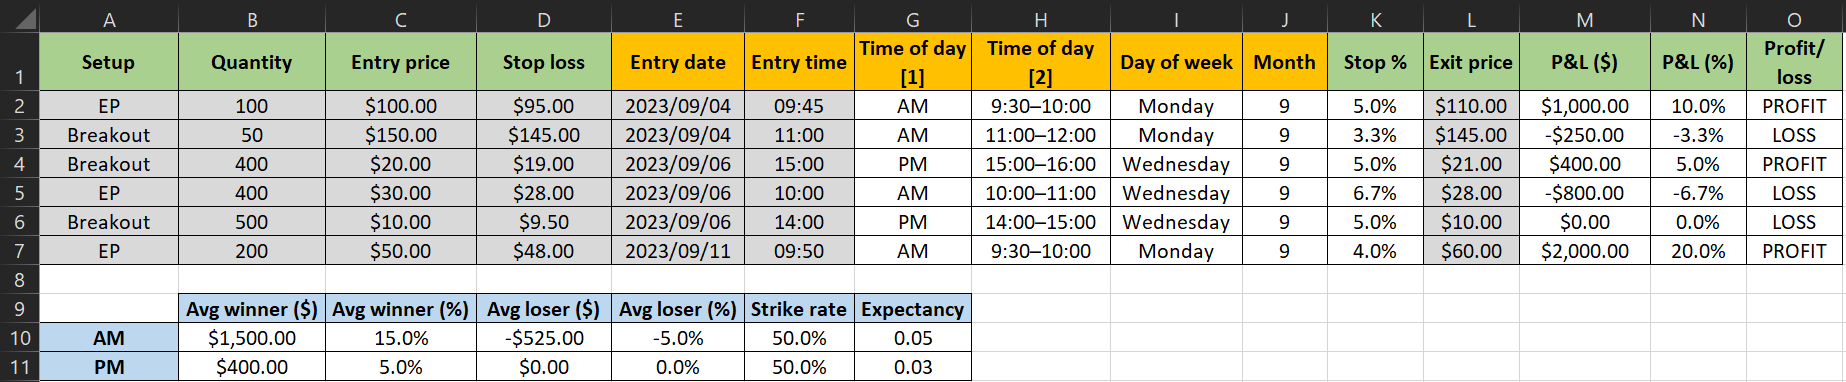
Manually enter the data for columns E and F (entry date and time). If you want to format them the same way I did, I used custom formats ‘yyyy/mm/dd’ and ‘hh:mm’ respectively.
It really depends on how you trade to decide which of columns G and H you want to use for your analysis. That said, column H is significantly more granular, so does work best if you have a large data set. The formulas are:
Column G. Use for G2: =IF(F2="","",IF(F2<TIME(12,0,0),"AM","PM")). Copy and paste it to the remaining rows.
Column H. Use for H2: =IF(F2="","",IF(F2<TIME(10,0,0),"9:30–10:00",IF(AND(F2>=TIME(10,0,0),F2<TIME(11,0,0)),"10:00–11:00",IF(AND(F2>=TIME(11,0,0),F2<TIME(12,0,0)),"11:00–12:00",IF(AND(F2>=TIME(12,0,0),F2<TIME(13,0,0)),"12:00–13:00",IF(AND(F2>=TIME(13,0,0),F2<TIME(14,0,0)),"13:00–14:00",IF(AND(F2>=TIME(14,0,0),F2<TIME(15,0,0)),"14:00–15:00","15:00–16:00"))))))). Copy and paste it to the remaining rows.
Columns I and J, which we won’t need until later, but to keep all formulas together, use:
Column I. Use for I2: =IF(E2="","",WEEKDAY(E2,1)). Format I2 as the custom formatting ‘dddd’. Copy and paste it to the remaining rows.
Column J. Use for J2: =IF(E2="","",MONTH(E2)). Copy and paste it to the remaining rows.
Now for the fun part: analysis. For this, we’re taking the same approach as for calculating your expectancy by strategy or setup.
Assuming the simpler approach (AM/PM), the formulas are:
B10: =AVERAGEIFS($M$2:$M$7,$G$2:$G$7,A10,$O$2:$O$7,"PROFIT")
C10: =AVERAGEIFS($N$2:$N$7,$G$2:$G$7,A10,$O$2:$O$7,"PROFIT")
D10: =AVERAGEIFS($M$2:$M$7,$G$2:$G$7,A10,$O$2:$O$7,"LOSS")
E10: =AVERAGEIFS($N$2:$N$7,$G$2:$G$7,A10,$O$2:$O$7,"LOSS")
F10: =COUNTIFS($G$2:$G$7,A10,$O$2:$O$7,"PROFIT")/COUNTIFS($G$2:$G$7,A10)
G10: =C10*F10+E10*(1-F10)
Copy and paste these for row 11.
If you want to take the more granular approach, add the necessary rows, complete column A with “9:30–10:00” etc., change “$G$2:$G$7” to “$H$2:$H$7” in all the formulas, then just copy and paste row 10 to the remaining rows.
Whichever of these two approaches you take, the conclusion-drawing process is basically the same as described earlier for analysing your results by setup. Again, remember that the larger your data set, and the bigger the differences between groups, the more significant your results.
Different days of the week
Do you trade consistently well or badly on certain days of the week? At least for the year in play? Let’s find out!
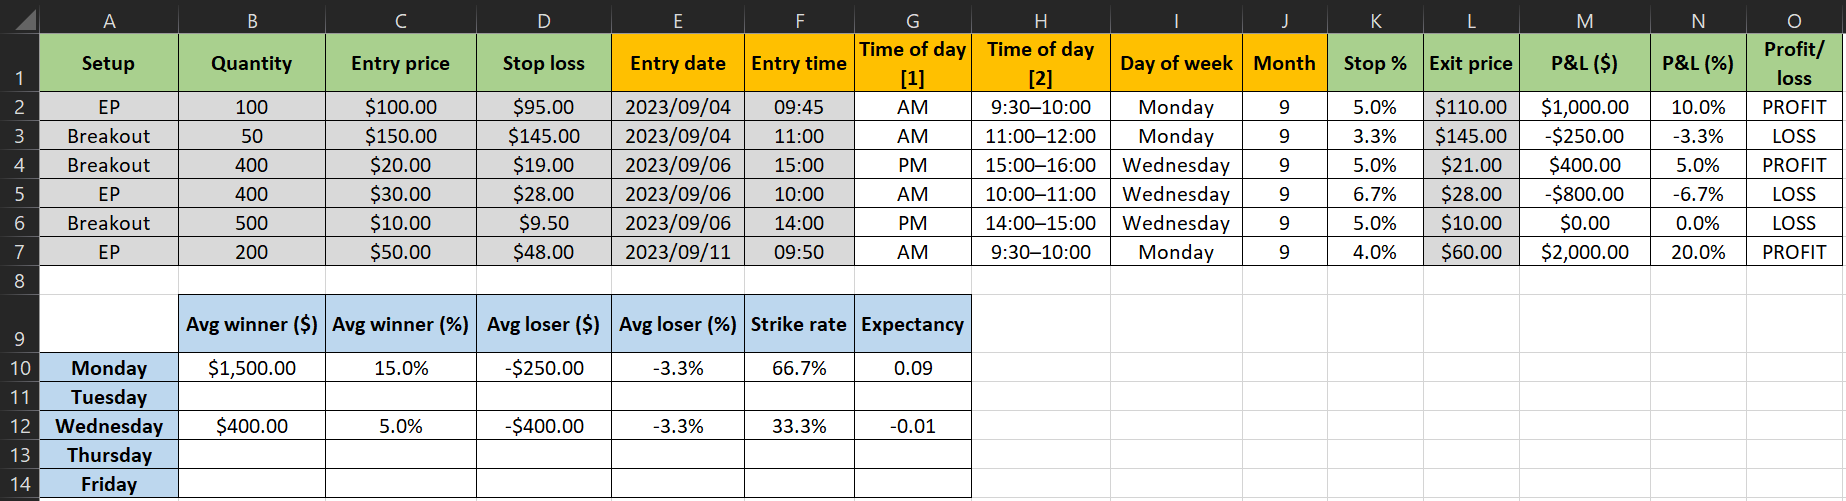
N.B. Because the sample data set is so small, I couldn’t have trades for all days of the week without breaking anything (by attempting to divide by zero). But the formulas will work for the full table A9:G14.
The inputs for A9:G14 are:
A10: 2. Custom format ‘dddd’. (Then A11 is 3, A12 is 4, etc.)
B10: =AVERAGEIFS($M$2:$M$7,$I$2:$I$7,A16,$O$2:$O$7,"PROFIT")
C10: =AVERAGEIFS($N$2:$N$7,$I$2:$I$7,A16,$O$2:$O$7,"PROFIT")
D10: =AVERAGEIFS($M$2:$M$7,$I$2:$I$7,A16,$O$2:$O$7,"LOSS")
E10: =AVERAGEIFS($N$2:$N$7,$I$2:$I$7,A16,$O$2:$O$7,"LOSS")
F10: =COUNTIFS($I$2:$I$7,A16,$O$2:$O$7,"PROFIT")/COUNTIFS($I$2:$I$7,A16)
G10: =C16*F16+E16*(1-F16)
Copy and paste B10–G10 to the remaining rows.
As ever, there are many ways to get your answers. The other week, for example, I saw a different approach on X/Twitter.
Difficult months
I’ve heard many traders say that they consistently perform badly in one or several of July, August and September. Again, everyone needs to take a holiday at some point — it might as well be when you historically do badly anyway. Note, however, that you will need to be trading for a few years to be able to analyse this data usefully.
As I expect any trader surviving that long to already be analysing their monthly performance, and don’t want this stack to become too long, I won’t geek out on Excel here. Though if you want me to, let me know in the comments below.
Performance in different markets
From 24:35, Tom talks about looking into how well you do in different markets, and gives a couple of different examples, including a trader who could not make money in the DAX, but could — trading in more or less the same way — in the Bund, which is a slower-moving market.
I’m aware that many of you — like myself — trade equities, but you can look into a similar sort of thing. Look into your performance in different market caps, for example, or different ADR ranges to see if you perform better in more volatile stocks or slower-moving names. Or if you feel that you cannot trade biotechs, for example, why not take a look at your numbers to conclusively find out whether that instinct is correct?
In part 1 of this series, I already talked about how I discovered, to my big surprise, how I was comfortably profitable in large caps — but no other market cap. Even though I was a losing trader at the time, that boosted my confidence in a big way. I’d just discovered that I can be profitable, if only I make a very basic change to what stocks I trade!
I couldn’t tell you what your eye-opening moment might be, but I hope the above triggers some ideas for you.
About asking others what to do
This is probably an unpopular opinion among Qullamaggie followers, but very often, I see a trader asking what other people think about stock XYZ, only to be told to avoid it because it’s a low ADR name.
I don’t think it’s a great sign if a trader needs to ask that about XYZ to begin with. But putting that aside for a moment, I don’t think they should be told to avoid it simply because it’s a slower-moving name. I think that trader should be told to look into how well their past trades have done in slower-moving/low ADR stocks vs more volatile ones.
Linked to this, whenever someone asks me what they should do, I always tell them that they should consult their journal and/or study a few hundred charts to find the answer to their question. I like to help traders improve, and sometimes can and do suggest concrete metrics to look into, but can’t do much more than that. I can’t find anyone else’s edge for them — they need to figure that out for themselves. Even if I did figure out how someone else could be profitable, they’d have no conviction in that anyway. Not unless they confirm it for themselves.
Traders like Tom Dante and Qullamaggie (among many others) can definitely push your boat out. Both of them certainly helped me — Qullamaggie from a strategy point of view, Tom from a journal analysis perspective, and both of them in terms of mindset. But we must learn to row for ourselves.
Conclusion
I hope my notes inspire you to really look at — and act on — your numbers. To spark a few ideas. To enable you to make some discoveries, about your own trading, that can permanently alter your results for the better.
I know it’s possible, because Tom’s video did that for me.
Don’t get me wrong: I’m still on my trading journey as much as anyone else. I still have so much to learn — about trading, about the markets and about myself. About writing too, for that matter.
In other words, the video isn’t a silver bullet.
But it did mark a huge turning point for me. It showed me how I could look at some really simple metrics to quickly make improvements. Improvements I could instantly have true conviction in, because they are based on my own hard numbers. And, more importantly, because I could immediately see the impact on my bottom line.
I hope the video — and my notes — can have a similar impact on you.
Failing that, I hope they offer you a new tool for your toolbox. A means of strengthening your conviction. A new way of confirming that you are doing a good job at position sizing and progressive exposure, if nothing else!
Thank you!
As always, thank you for reading and all your support. Words fall short of just how much I appreciate it!
If you found this stack useful, please do like and share it. It really helps me out.
Also, I always love to hear from readers. Please do leave a comment below, message me on X/Twitter or email me at kayklingson@yahoo.com.
The other day, a reader emailed me a link to a YouTube transcription tool they thought might be helpful — it was. A few days before that, I received a very insightful audio message from a reader that provoked a new stack idea.
I love surprises like that, as well as getting a chance to connect with a few of you! Keep them coming — I respond to all messages :)
More content like this
The fourth and final part of this series focuses on generating new ideas and coming up with new patterns.
Also keep an eye out for a new stack or, more likely, a new stack series on David Ryan.
If you missed them, please do look up part 1 and part 2 of this series.
All my Tom Dante notes are here. All my notes about quantitative analysis are here.
The Trading Resource Hub’s full archive is here.