

Discover more from The Trading Resource Hub
Audio available at the end of this post.
Dan Zanger famously turned $10,775 into:
$2.6 million in 12 months
$18 million in 18 months
$42 million in 23 months
In various interviews, he underlined the importance of chart patterns, along with price and volume. He’s even named his website chartpattern.com.
And yes, setups are important for getting good entries. But a setup alone can never be an edge.
As Stockbee put it: chart patterns are just one element of Zanger’s system. Believing that this is the main reason for his success is a “myth”.
What are some other elements to a wildly profitable trader’s system?
Stock selection
Chart pattern nuances
Though not always explicitly addressed in Zanger’s interviews, the clues are there.
Let’s take a closer look at these three elements, Zanger style.
1. Stock selection
You don’t become a profitable trader (outside raging bull markets) if you just randomly buy textbook chart patterns/setups. You have to be selective.
Groups (themes/sectors)
For a start, pay attention to “groups” (Zanger’s word choice two decades ago — now typically ‘themes’ or ‘sectors’). To quote Zanger:
“You have to know what’s hot and follow that stock or group.
“I find out who the winners are and stick with them, moving in and out until they begin to fizzle.”
The article explains:
“In early 1998, Internet stocks exploded, and as they cooled in late 1999, biotechs took off. They ran for six months; then fiber-optic stocks took over in 2000 and cooked until Nortel preannounced a shortfall in earnings.
“Zanger has found that such groups run for around six to 18 months, and then it’s time to move on.”
In a different interview, Zanger commented:
“I foretold the biotech move two or three months ahead of time.”
How? Situational awareness, which we’ll get to later.
To learn more about how to build your own theme watchlists, see this stack.CAN SLIM
As previously mentioned, Zanger frequently points to CAN SLIM as the inspiration behind his own trading strategy.
Specifically, in 1989, he attended a seminar delivered by William O’Neil, who presented chart patterns and the CAN SLIM formula.
Chart patterns
After that, Zanger made a serious effort trying to find those chart patterns in his charting books. In his words:
“I would overlay a chart pattern over stock charts, and do this every evening and for about six hours every Saturday and Sunday until I finally found one. I would keep doing this over and over for thousands of hours until I could identify the cup and handles.
“Then I got pretty good at it and realized that there was a lot more to it than the cup and handle or channel patterns that [O’Neil had] taught us.
“So, I called him up one day, because he had a weekly TV show back then, and asked him if he had an advanced course. He said that was the advanced course.
“I realized I was on my own and spent the next six years learning everything I could about trendlines, daily bars, reversal patterns, how to spot a correction and so on.”
That final paragraph makes clear that being able to recognise the broad chart patterns (cup and handles, double bottoms, etc.) aren’t enough. It’s about being able to see the nuances around them. This ties into things like:
Paying attention to sector/theme;
Situational awareness (detailed later); and
Spotting the details of a chart, like volume and behaviour (detailed later).
Earnings
But understanding the market you’re in isn’t the only fundamental factor Zanger pays attention to. As per CAN SLIM, he also places a lot of weight on earnings. Zanger explained:
“I want to know that a stock has powerful earnings growth and expansion in margins behind it.
“I typically look for a stock with a minimum of 40 percent year-over-year growth. That’s kind of my base minimum.
“First, I find stocks that are moving up fast, and then I’ll start to track them on my quote screen. I’ll do some fundamental work on them. If I like the group and what they have, I’ll track them even closer on my monitors.
“I have a top-down approach on my monitors. Volatile stocks make the top of the monitor. Stocks that don’t act very strong keep moving down.
“I am shifting stocks continuously on my quote screen according to how they act. As the stock becomes very volatile, I’ll move it to the top. I’ll do some fundamental work on it and make sure that it is a very fast grower.
“If it can grow like an Amazon or Yahoo used to do, then I’ve probably found a stock that’s going higher.”
Stockbee also wrote a blog titled “Earnings and Dan Zanger”, which features more quotes from Zanger that show just how important earnings are to finding explosive movers.
Earnings also came up in my first Zanger stack, and is a common catalyst for episodic pivots (EPs) — particularly the EPs that trigger big, sustained moves.
Low float and low institutional sponsorship
Here, we’re getting into more classic CAN SLIM territory. We’re also overlapping with my stack on criteria for more explosive EPs, which included:
Low float. Stocks that have a small float are much more likely to move explosively (whether as an EP or a breakout) when strong demand comes in.
Low fund ownership. You need institutional sponsorship (i.e. big buying) for a stock to be able to really explode upwards — but all the big players that want to own this company can’t all be holding shares in it already. You need new buying and, preferably, new buyers, so you need low fund ownership at the time of entry.
Something new
‘Something new’ (another CAN SLIM characteristic) cropped up in my first Zanger stack, too. If you’re dealing with a young company/recent IPO, fewer institutions are already in the stock.
What’s more, if the company is truly doing something new (AI being the obvious example at the moment!), there’s every chance that they don’t just create their niche, but dominate it.
It reminds me of what Nicolas Cole (the writer) often says:
“Growing up, we’re taught to choose an existing industry and then ‘compete’ our way up the ladder. But this is not what legendary writers, creators, and even entrepreneurs do. Instead, they become known for a niche they own.
[…]
“How fast does word-of-mouth marketing spread when everyone uses the same word to describe who you are and what you write about?
“The answer is: very fast.
“Your goal as a writer (or creator, or entrepreneur) is not to become ‘the best’ in an existing category.
“Your goal is to create your OWN category.”
(The full tweet explains in much more detail, with examples.)
Zanger basically says the same thing, albeit in a trading context:
“[My method finds] fast growing companies, and leading groups and companies, that dominate their space in the global environment.
“You will find some incredible winners in the marketplace by following that method. Certainly, Apple dominates its place in the iPod market. They not only dominate it, they created it.
“Google created the pay-per-click advertising and they dominate it.
“These are global companies with leading niches. They dominate and control their space. These are the types of companies that I look for.”
2. Situational awareness
I tweeted the above based on my first Zanger stack, which talked a little about market conditions. This stack with Anthony Shi explains market cycles in much more depth.
When you understand market cycles, and can read charts to the level that Zanger can (more on that later), it looks a bit like this:
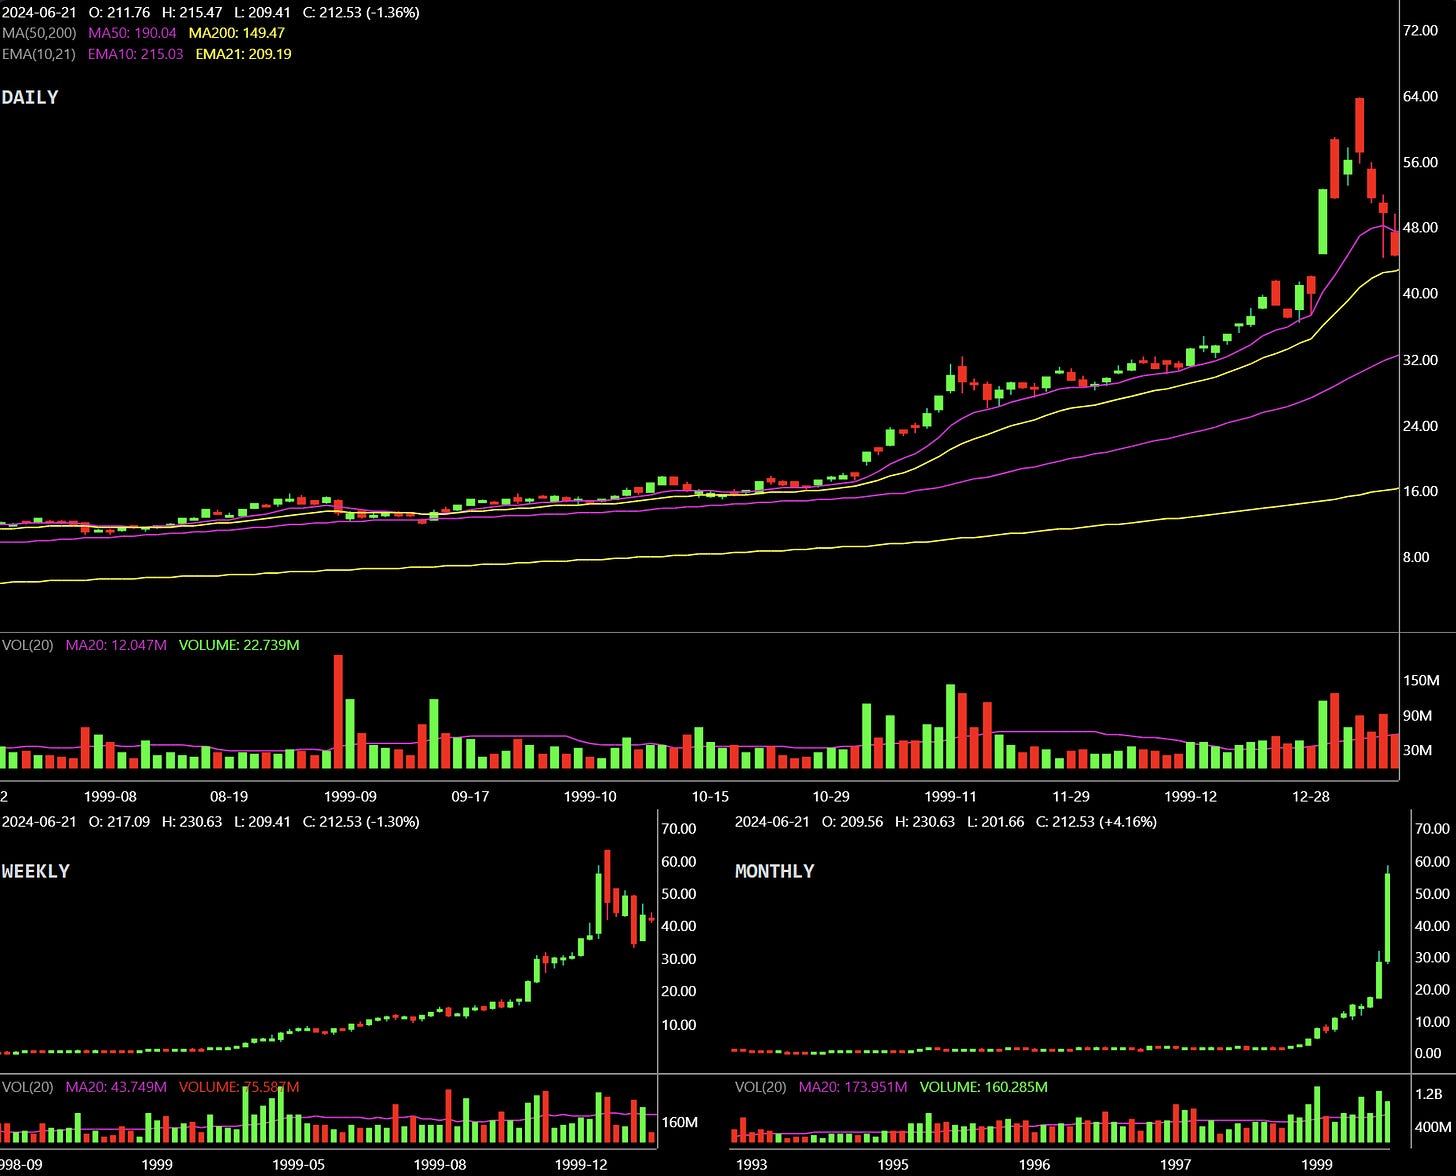
“At the beginning of November [1999], Zanger noticed that Qualcomm’s stock was acting ‘a little frisky.’
“So he dove in, buying 5,000 shares on the way up from a split-adjusted $57.50 to $62.50. In a matter of weeks, the stock was trading as high as $93, but was incredibly volatile.
“Zanger hung on, buying and selling parts of his position on dips and spikes.
“By December 30, the price had leaped past $161. On the first day of the New Year, the stock jumped a bit more, and Zanger unloaded his remaining positions at $196 and $194 for a profit of $2.7 million.
“How did he know to sell near the very peak? ‘It was clearly in a massive parabolic blowoff top,’ says Zanger. Obviously.”
“For me, trading is one day at a time.”
But there’s real wisdom to be gained in this 2006 interview, too. When asked about his market outlook, Zanger said:
“For me, trading is one day at a time.
“I never say the market is going to go up or down. If you trade on a forecast like that, and you load up, the market can turn on you and you can really get hammered.
“I have a few market timers who send me stuff and it is interesting and that’s fine. But I don’t really rely on it for trading.
“For example, you can be loaded up on chip stocks and say all of a sudden the leader in the group says that they don’t see earnings continuing and then the whole group takes a 15% discount and you are on [2:1] margin.
“This may cause you to take a 20–25% loss on your positions. You can really get hurt on this.
“I don’t believe in anything but my charts and my price action with stocks.”
3. Chart pattern nuances
Zanger used to look at 1,400 daily stock charts every night, which might be as high a number as I’ve heard anyone name for a daily routine.
In a later interview, he said he ‘just’ looked at 600–700 charts during the week, and 1,400 on weekends:
“By going through my full list of 1,400 stocks, it gives me an idea of what is going out of favor and which groups are starting to turn up.
“It gives me a pretty good indication by going through my entire database as to which groups are coming up and which ones are lagging.
“I try to focus on the strongest stocks in the strongest groups.”
Combine that with the amount of hours he consistently put in for years before making his record-breaking returns, and you start to understand how he has such in-depth knowledge of chart patterns.
It’s the deep dive Stockbee is always telling traders to do. It’s the deliberate practice both Clement Ang and myself have talked about on this Substack.
Every pattern only works some of the time
Zanger looks at “a good dozen patterns overall”, according to this 2004 interview.
His website currently lists 11 of the “most common” chart patterns (both bullish and bearish):
In an interview, Zanger explained how some patterns work better in some market conditions than others:
“In some markets I’m looking for falling wedges, descending trendlines, descending channels, to name a few. In other markets, I might be looking for horizontal channels and cup and handles.
“These last two are probably the most powerful patterns as the correction is winding down. Stocks that have the cup and handle pattern will often explode and move first out of a correction.”
Qullamaggie said something similar — albeit at a higher level — during various streams, including 23 May 2023. Specifically, that breakouts work best in small and mid caps (lower float, less institutional sponsorship), in an uptrending market. In a range-bound market, buying bottoms and EPs work.With that in mind, Zanger’s favourite pattern depends on the market he’s in — again, situational awareness! In 2010, he said:
“I think the descending channel for buying is one of my favorite patterns as the market has become more choppy and volatile. You are seeing more descending channels and island reversals for buying.
“There was an island reversal in January which started stocks on their way down. The market consolidated […] for 3 to 5 weeks and then got up on the right side. The market then gapped back up. That created the island.
“Some of these islands have been very powerful. We caught $RIMM about a year ago on a big island reversal and picked up about 30 points on that one.”
But in 2004, Zanger said:
“After the market has moved up, the bull flag is one of my favorites. Certainly the cup and handle is very powerful.
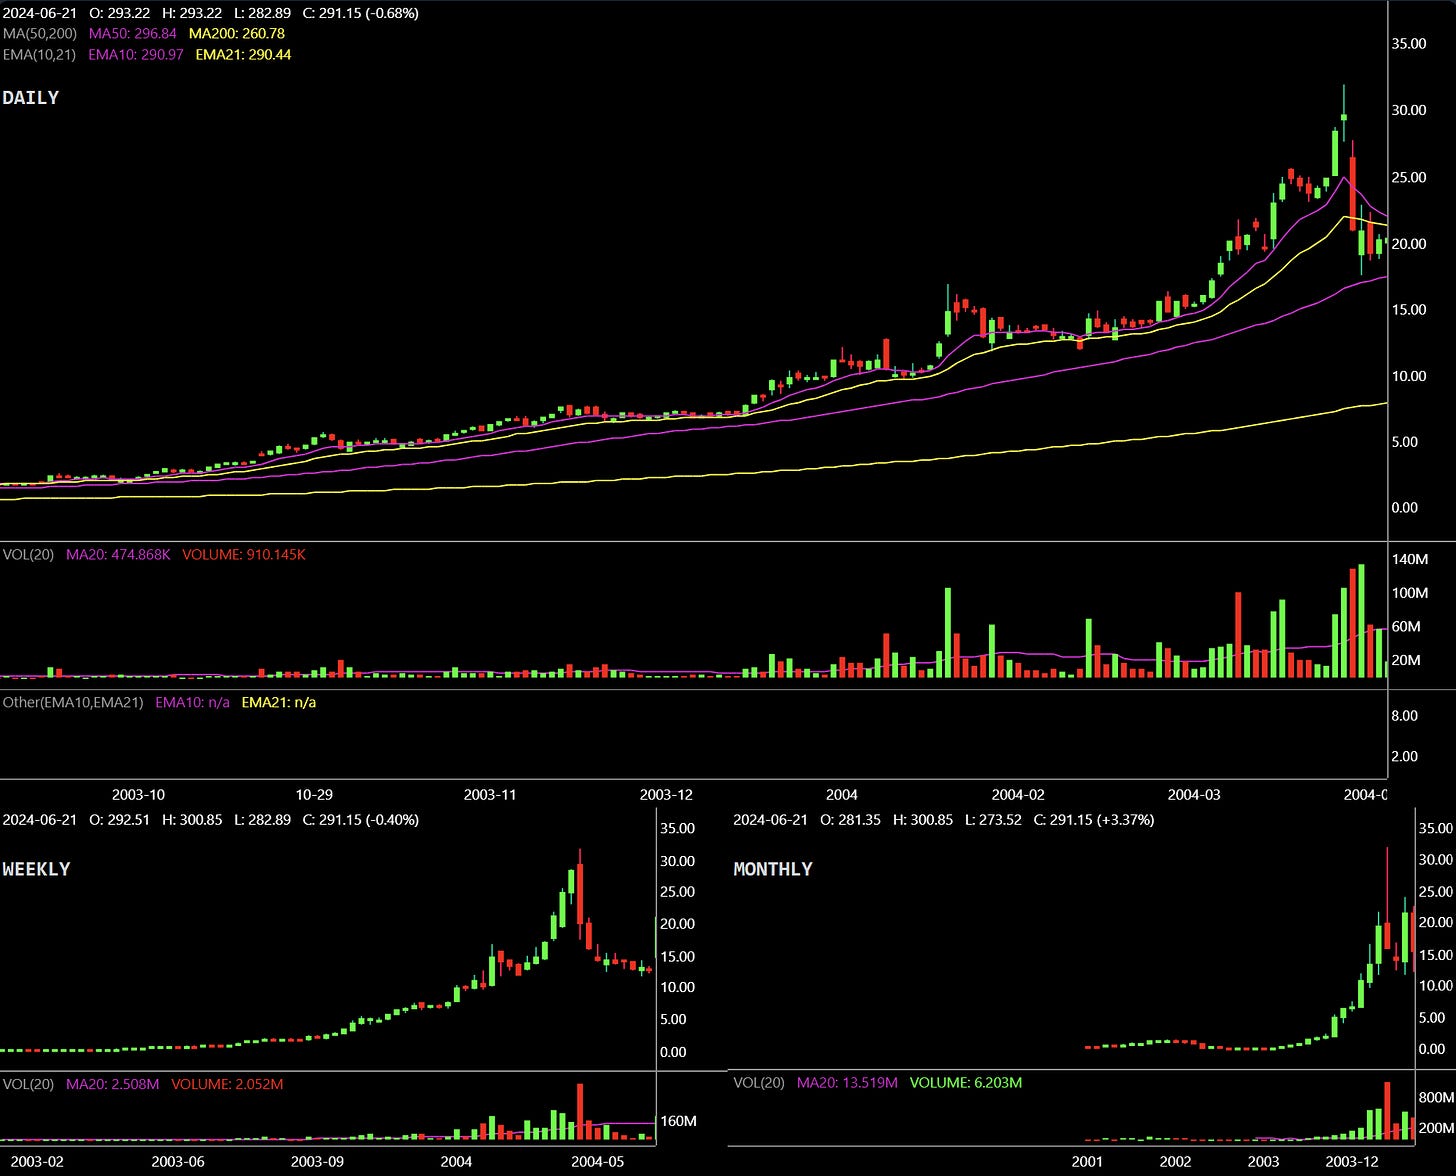
“We just saw Taser Inc. [then $TASR, now $AXON] lift off after the correction from March [2004]. $TASR had a little cup and handle inside an ascending triangle.
“I highlighted it on my website Chartpattern.com at $61. Sure enough, the stock exploded to $87 in five trading days and to $128 in 16 trading days. That was the leading stock of this move.
“That was the only stock that had a very tight, discernable pattern at the bottom of the correction. That stock was the number one stock to be in. The majority of my money was in that stock.”
Patterns aren’t enough
I thought
explained the crucial points on the relationship between chart patterns and market environment very well in this tweet:“The unfortunate paradox in trading is:
“If you do the exact same thing all the time, you’re going to get different results.
“This sounds counterintuitive, but it’s just the nature of the ever-changing market cycle. The market transitions from uptrend to downtrend to sideways trend.
“While your setup shouldn’t fundamentally change, what should change is your aggressiveness based on your perception of market risk, which is influenced by factors like the trend of indices, sector performance, market breadth, and overall market sentiment.”
The full tweet goes into much more depth — well worth reading.
Coming back to Zanger, this interview highlighted really well how just a pattern isn’t enough:
“Sometimes these patterns yield weak moving stocks and sometimes they yield very strong moving stocks.
“Like any pattern where a stock breaks out, the pattern alone does not guarantee a winner.
“This is a big fallacy for people who are tying to trade off of chart patterns. They think that patterns are the new thing and that is a no-fail system.
“Patterns just give you a leading indication of which stocks are ready to move. Be prepared for the failures. Be quick to cut your losses.
“When they really start to move big, with big volume, you need to really step into the stock heavy.”
Which leads nicely into the next point.
Volume and stock behaviour
In most longer interviews, Zanger makes a huge point about volume. Here’s an example:
“I go with the big funds. When the institutions are buying the stock en masse on volume, I will buy the stock too. When I see a stock beginning to move on heavy volume, I will be a buyer with the other institutions.
“Volume is extremely important. It fact, it’s everything.”
And in a different interview:
“I look at daily bars intensely and dissect them and then add in the volume bars to come up with sort of a pressure factor that tells me what the stock wants to do next and when it wants to do it. Is it ready now or does it need more time?
“That’s the job at hand every day.”
I also highlighted this in my first Zanger stack. He looks for surges in volume and wants to see how the price responds to those surges. It gives him clues about the stock’s behaviour.
To help him identify these volume surges, Zanger uses the 20-day moving average for volume, and looks for relative volume of at least 300% — but the higher, the better.
During the trading day, he watches around 60 stocks. Zanger also said:
“I have all the stocks memorized because I have done my homework the night before. When the market opens, I know what is moving, what looks good, what is sluggish, what is not moving, what is trying to move, what is faking you out.
“You really have to spend a lot of time in the market every day. I spend 12 hours at it every day, studying my charts, and watching volume behavior and price movement when the market is open.
“Every day when the market is open, that is everything to me. I want to see the behavior, behavior is everything.”
And later in the interview:
“If a stock really does not act right, and get up and go when it breaks out, for example, I would just sell the stock right there. I would not even wait for it to come back down to the breakout point.
“If you want to make money in stocks, you have to be in stocks that are moving up. The longer it continues to move up, the more money you make.
“If the stock breaks up and then goes to sleep, I am out of the stock. I want to keep my money in those fast-moving stocks that are always moving up.”
Zanger gave another example of that in this interview:
“I want to see how the institutions are treating the stock […] by watching the ebb and flow during the day.
“I watch bid, ask, and volume as well as price change through the day, and I watch how they run through it on volume spikes. I watch to get a feel of the stock on the quote screen.
“On various chart patterns, stocks should be doing certain things at certain times. When the stock is acting right, volume should come in and do certain things.
“If it doesn’t do what it’s supposed to do, when it’s supposed to do it, then something isn’t right and I’ll pass on that stock until the time is right.
“A stock might suddenly go limp or it may be very hot for a week and then volume just disappears. Whoever was playing with the stock is gone and if they’re gone, then so am I. If it’s no longer the stock it was last week, I’ll just walk away until it gets frisky again.”
In various other interviews, Zanger goes into more specific examples. I may collate these in a separate stack in due course.
Before we get to the concluding section, a quick request.
I’ll never paywall this Substack. I made that decision from day one. But if you got this far, chances are you find my writing valuable.
If so, I’d love it if you bought me a coffee to support my work:
Final thoughts
Zanger summed things up rather well himself:
“[Watch] the behavior action of the stock, [do] some market timing and cycle work, and really [tune] into your stock’s behavior and its price action.
“Many people choose a stock and say they are going to wait for this stock to move up. Meanwhile, they missed a 30-point move on a stock sitting right next door to it.
“Really focus on the stocks that are going to move now.”
And in a different interview:
“I trade whatever the market is going to push up the most.”
That, of course, is key to superperformance in the markets.
I must admit that it took studying, and working with, Anthony Shi for me to truly understand how much stock picking matters.
Like every novice trader, once I learnt about setups, I thought that a setup equals an edge. My first choppier market quickly disabused me of that notion.
As I studied more, I realised the importance of themes and market environment.
I also frequently heard that you have to narrow your focus: pick just one or two setups, and master those. This is well-intended advice, designed to prevent strategy hopping, which people are unfortunately prone to doing once their trades inevitably stop working.
But because I followed this advice to the letter, I failed to recognise how different setups interplay. In turn, I failed to appreciate that my top priority is identifying the strongest stocks, and then finding a way of getting into them.
Instead, I’d been choosing my setup, then flipping through tons of charts to look for that setup. The inevitable result was rarely being in the leaders, or else being shaken out of them, because I was buying a breakout in a stock that had a history of moving on, say, an EP.
Put differently, I badly needed Anthony’s insight:
“Broadly speaking, you get two opportunities to go long on a strong stock:
The EP: you spot a gap up on huge volume following a catalyst and, preferably, a period of neglect.
The breakout: after the EP and PEAD [post-earnings-announcement drift], a flag forms, which becomes increasingly tighter until the range resolves itself, breaking either out or down.”
The idea being that you pick your stock, and then think about what entry tactic gives you the best odds of success, taking into account stock behaviour and market environment.
It’s about understanding how all these patterns are linked. And how you need to study variations of your setup — something Qullamaggie says a fair bit, too.
Studying Zanger with fresh eyes really brought those lessons home again. This interview summarised the key points well:
“I follow groups not indices per se. I have never really made any money by following the indices.
“I am more of an individual stock picker. The stock may be in a group that is turning up.
“I want to be in two to four stocks in the strongest groups.”
Also:
“You have to be selective. Just because a stock has a pattern it still may not be worth owning.
“Just because it has a pattern and breaks out doesn’t mean you want in on the stock. Visa broke out and had a one-day move. The next day it was down a few points and stopped moving from there. It’s just a sloppy stock overall.
“If you buy a stock that exits a pattern and it goes nowhere, just check out and find something else. This is really just a numbers game and you need to be in the right stock(s) that move.”
In short, find the stocks that have the most room to go, and figure out a way of getting into them.
If you can get into the best names, you’re giving yourself a margin of safety (because they hold up best in corrections), as well as the best risk-to-reward.
I hope you found this stack valuable! As ever, if you did, please like and share it. If you loved it, maybe even consider buying me a coffee.
Listen to this stack
Further reading
The Trading Resource Hub’s full archive is here.




All setups need followthrough to work. What good setups have in common is that they are more likely to followthrough and offer a place to logically manage risk. Where they differ is the place in the chart where they originate from. I compare this to waves on the beach. If you watch waves they sometimes pull back a few meters before they have 'followthrough' back to beach. The next wave might pull back a lot deeper but can also follow through a lot more. If you're a surfer and you can find a good surfspot (stock selection), find a good wave (setup selection) in the right time of the year (market environment), you can ride a pretty big move. And ofcourse exiting the wave at the right time is crucial! :)
Wow, this stack couldn't have been more timely. I've recently been moving from looking for setups to placing more emphasis on the actual stock. Reading this stack, the next step will probably be learning to use a lot more different setups as tools to ride these stocks. Thanks!