
Doing a Deep Dive
What, why and how (step by step)

Audio available at the end of this post.
What is a deep dive?
A deep dive is simply a deep study of one specific setup, pattern or market behaviour. It means looking at 3,000+ examples of the thing you’re studying.
Virtually every successful trader has, at some point in their career — though the earlier, the better — done a deep dive on a specific topic or setup.
Consider, for instance, how David Ryan and William O’Neil studied the greatest winning stocks to identify what characteristics they had in common. They subsequently captured those characteristics in the acronym CAN SLIM.
Mark Minervini conducted a ‘historical precedent analysis’ of ‘superperformers’, which led him to his Specific Entry Point Analysis (SEPA®) and volatility contraction pattern (VCP).
Qullamaggie regularly talks about doing a deep dive, and building a database of examples of your setup. His own database — containing tens of thousands of charts — is Evernote-based:
Whether you call it doing a ‘deep dive’, or building your own ‘model book’ or ‘chartbook’, they all boil down to the same thing:
Studying specific parts of history to build up the database in your head to significantly improve as a trader.
Why do a deep dive?
Again, every successful trader will tell you that the solution to your trading problem is to do a deep dive. From that deep dive, you’ll develop an in-depth, nuanced understanding of your setup.
Then, you figure out how you can trade that setup in real time. What scan(s) you need, what criteria you’re looking for, etc.
As Stockbee points out, if you go through thousands of examples of your setup, and study those examples in detail, you’ll permanently alter your brain. As I recently tweeted:
“You must do a deep dive […] to develop true pattern recognition skill.
“You can’t just read a book, then go off abstract/textbook patterns alone. The reality is much messier.
“If you don’t build up a pattern database in your head, you’ll miss the nuance, and you can’t be an effective discretionary trader.”
Or to quote Marios Stamatoudis:
“[The more profitable] trader has a better, more cleanly structured database of events stored in their brain.
“A superior database enables better application of selectivity, [which leads] to better results. Studying only a strategy and its parameters isn’t enough [for outperformance].
“To truly excel, you must study stock market history through the lens of your strategy, seeking out commonalities among the best-performing setups.
“That is how you build your own superior database.”
While stock selection isn’t everything — execution is an even more important aspect of trading — stock selection is a key contributor to your performance.
How to do a deep dive
Note: These are very broad steps, so treat them as rough guidelines only. I didn’t want to make this specific to my setups — everyone’s deep dive is unique!
1. Decide what you want to study
Be specific. E.g. ‘liquid stocks that moved up at least 50% in 14 days over the past 6 months’.
2. Build a scan that will find your study subject
Sticking with the above example, here’s what Qullamaggie showed us during the 18 May 2023 stream, in context of finding EPs to study (using TC2000):
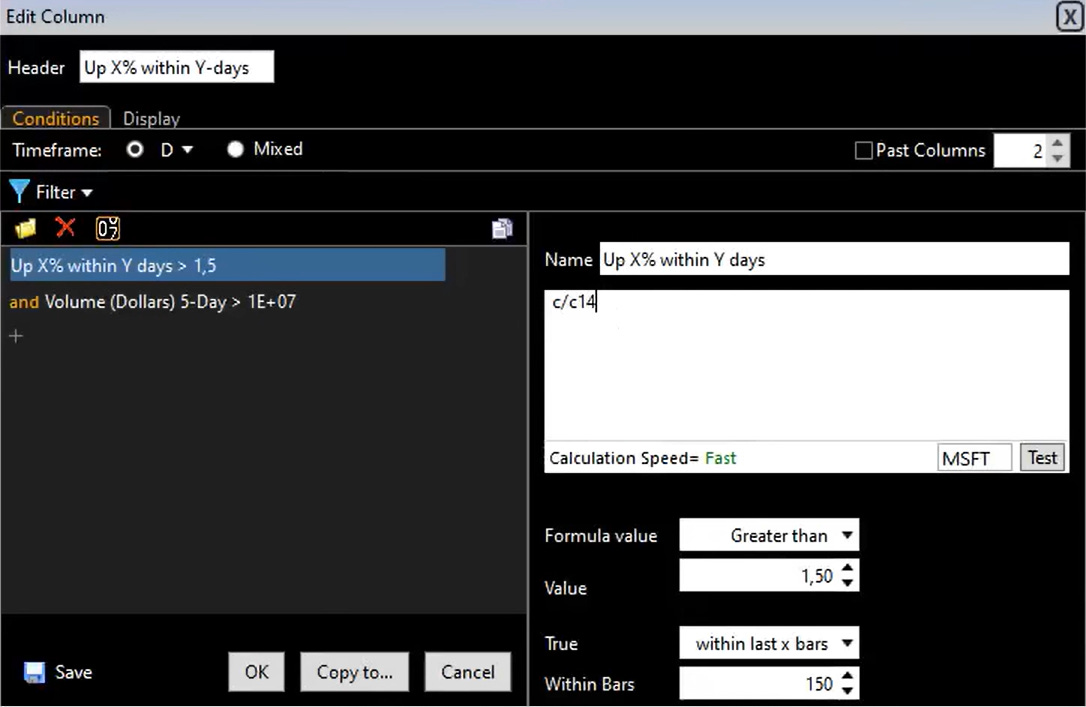
To explain in more detail what you’re looking at:
‘c/c14’: the current closing price/the closing price from 14 sessions ago. As another example, if you’re looking for five-day moves, you’d use ‘c/c5’.
Formula value greater than 1.50 — you’re looking for ‘c/c14’ to be greater than a 50% increase. Adjust accordingly if you’re looking for smaller or bigger moves!
True within last [150] bars — when I said “current” closing price, that can actually be the closing price anytime within the last six months. (Note that a year has 252 trading days, so Kristjan should have set this to ‘126’ rather than ‘150’.)
That third bullet is what makes this a historical study, as opposed to your daily homework to check what’s currently working, or a scan that tries to find actionable trades.
3. Add a plot to make it easy to identify your study subject
This is a Stockbee suggestion from this video:
Particularly when your search criteria can be true over many months or years, or you’re looking for a phenomenon likely to appear multiple times on a chart, you can make the moves you’re looking for easier to spot by adding a plot to your chart.
In this video, Pradeep is looking for liquid stocks, priced at $5 or higher, making at least a 20% move in five days. So, his formula is:
c/c5>=1.2 and minv3.1>100000 and c>=5If you wanted to use the example from earlier again, that’d be:
c/c14>1.5 and avgc5*avgv5>1000000Pradeep copies his formula, and creates a new plot (for TC2000, go to ‘Add Plot’ > ‘Formulas’ > ‘Write Indicator Formula’):
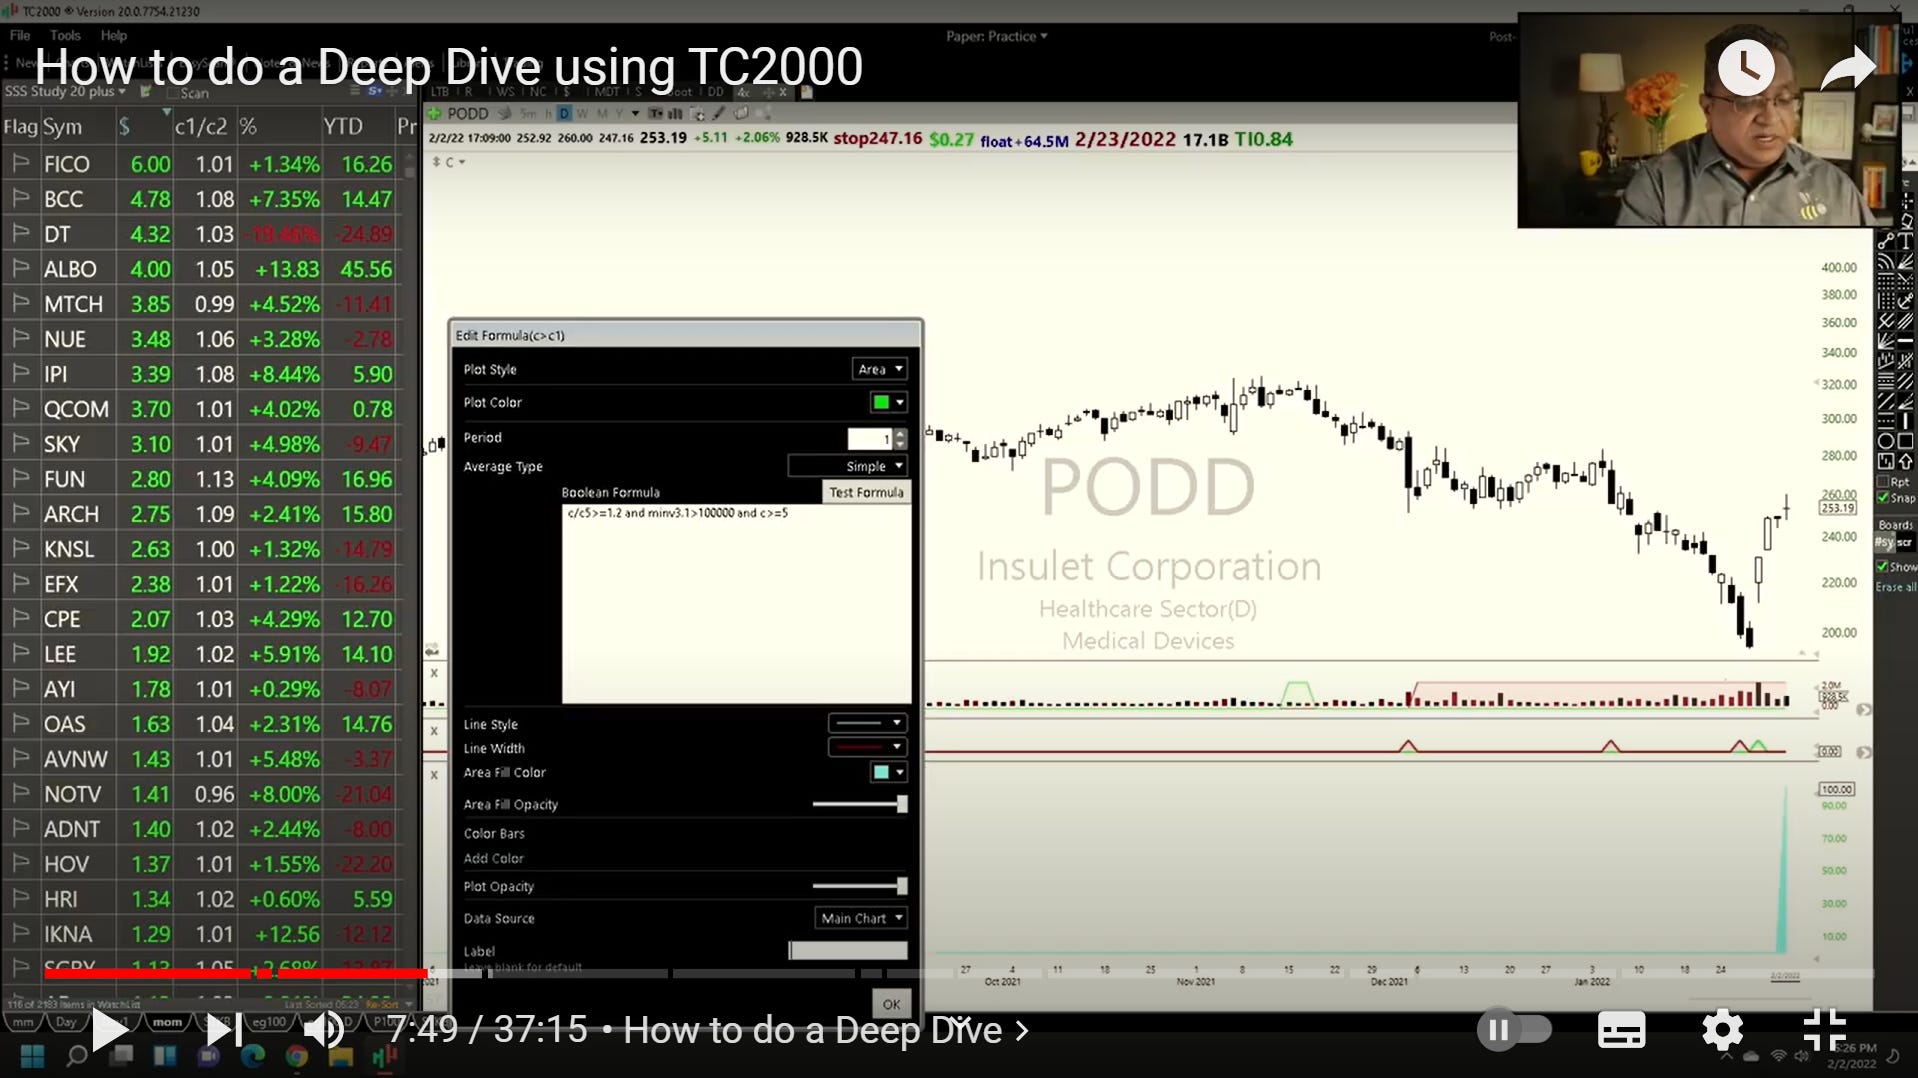
This is the bottom indicator on his chart screen. Where there’s a green spike, that’s where the stock made the move he’s looking for.
After adjusting the indicator/plot heights, and zooming out, it looks like this (I added a blue rectangle for clarity):
Now, at a glance, he can see that this stock made its first ≥20% move at the time of the video (February 2022) since March 2020.
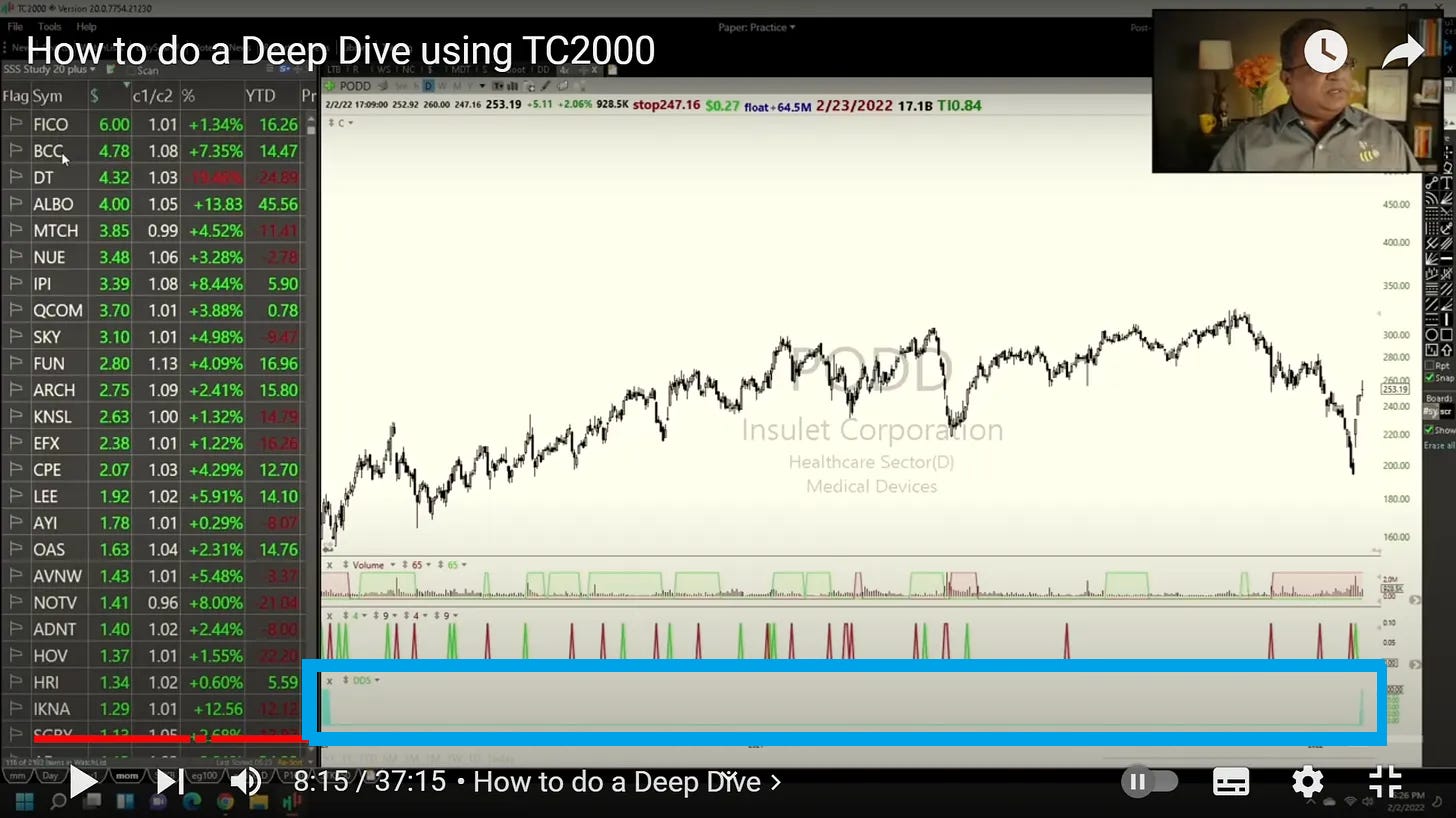
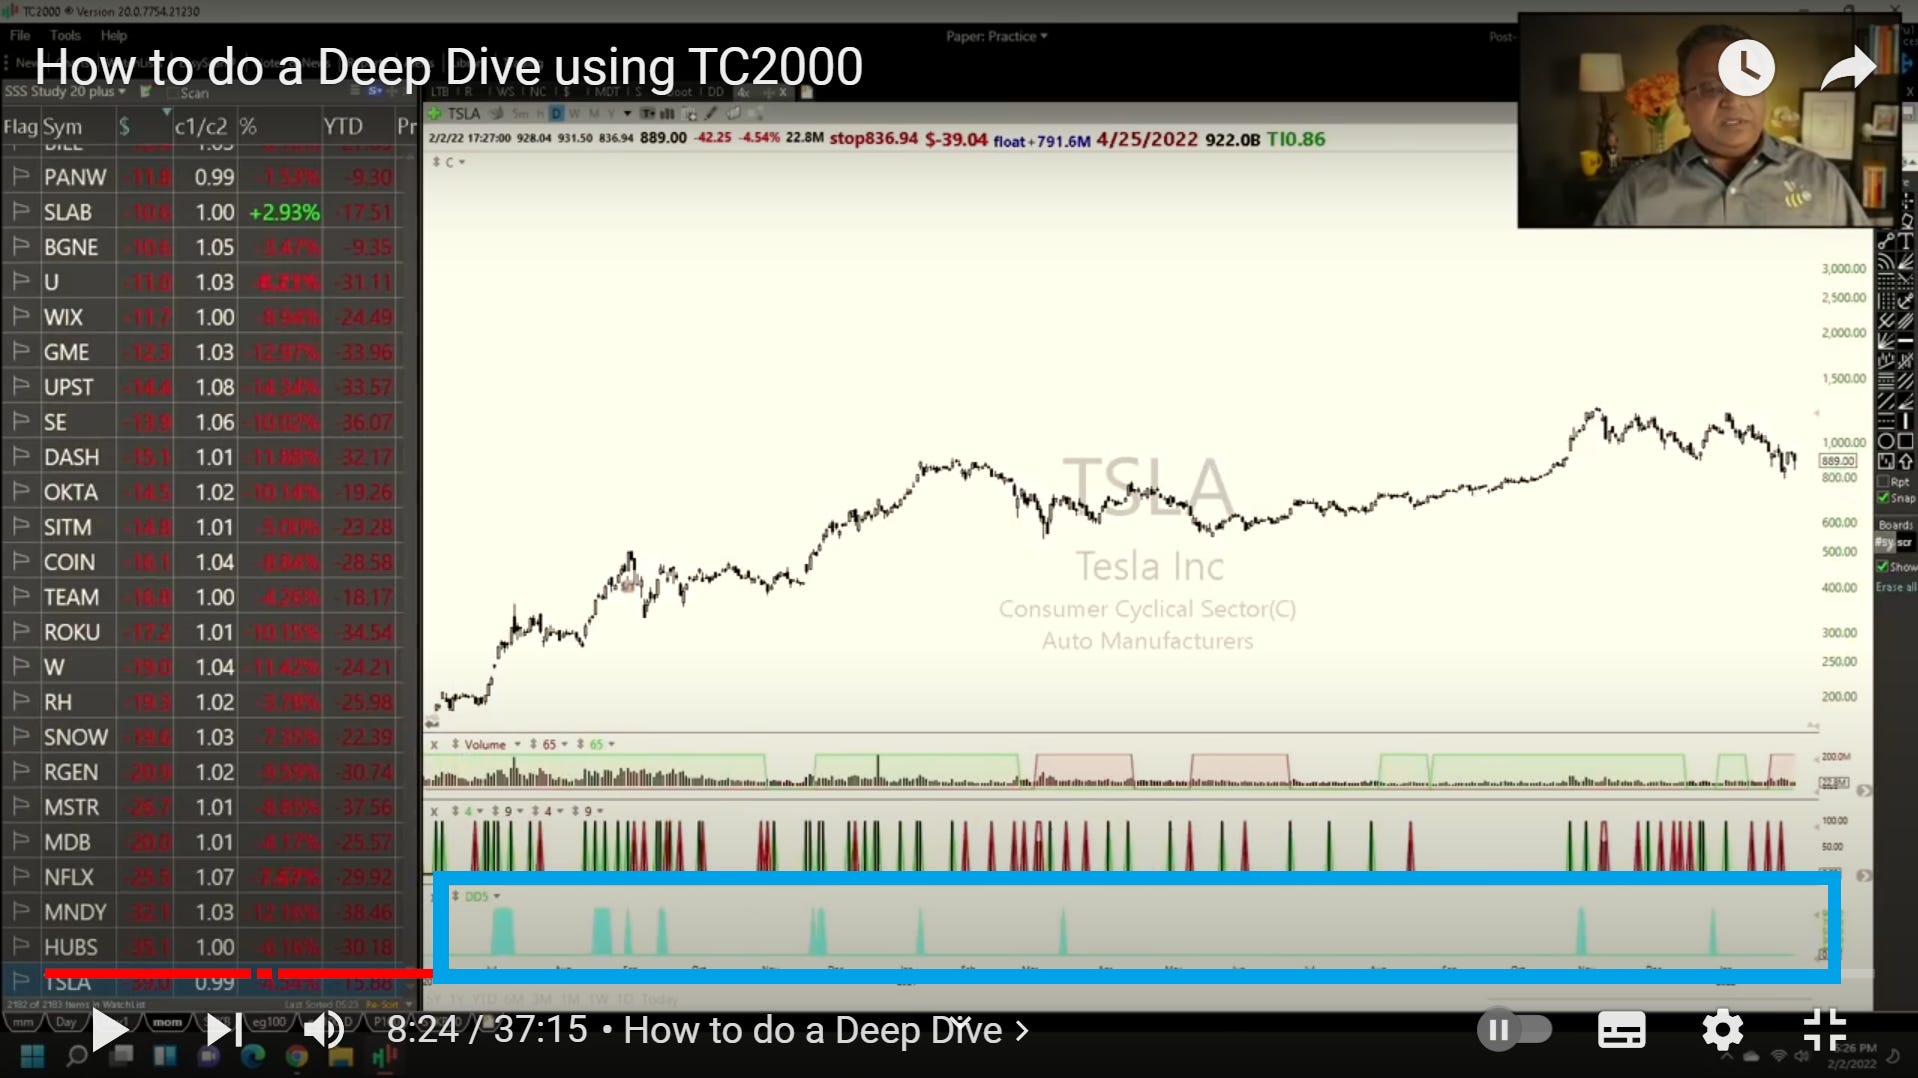
Look at a stock like $TSLA, and you can see it makes that type of move more frequently (I added the blue rectangle for clarity):
4. Go through the scan results, and collect examples in a database
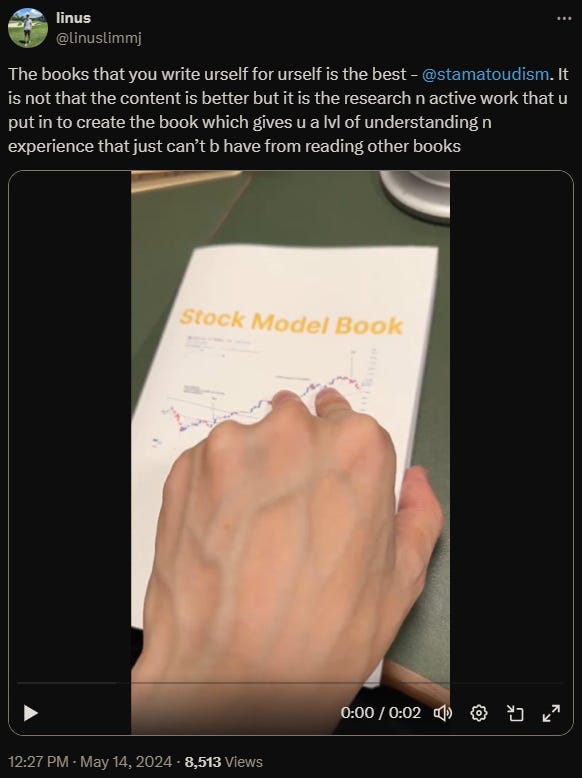
That can be something like Kristjan’s Evernote-based database. Or it can be a printed model book like this:
The key, however, is to do your own work. People regularly ask Kristjan if he can share his database/notes — thereby missing the point of this exercise.
The aim isn’t to create a beautiful textbook that rivals the classics.
The aim is the process itself.
Writing your own books (or in-depth notes) gives you a level of understanding of the material that mere reading or watching cannot.
5. Regularly study your database
Kristjan says you must spend at least 1,000 hours, across several years, studying historical patterns by regularly flipping through your database.
In fact, don’t consider your database a one-time event. Even Kristjan considers his database “work in progress”.
Again, the goal is to improve the database of events/patterns in your brain. Study historical charts through the lens of your strategy.
What do the strongest stocks (in context of the type of move you’re looking for) have in common? How do they act before the move? What about during the move? And what are signs that the move is over?
As you refine your answers to these questions, you refine and enhance your edge.
And who knows — maybe you’ll even discover your own unique pattern!
Accounting for market conditions
In the examples above, we looked at deep dives going back six months and one year.
However, that doesn’t cover the full range of market conditions. To capture them all, you should go back at least five years.
This is something to keep in mind as you’re building up your database. What period are your examples from? What was the market doing at that time?
Understanding how well your setup works during different market conditions is another important nuance to learn as part of your deep dive.
Stockbee tip: Take a ‘bootcamp’ approach to your deep dive
Pradeep shared an interesting tip in the video above (32:55): compress your studies (deep dive) into as short a time frame as possible. A bootcamp-like approach, basically.
Psychologists have found that if you study something under a lot of time pressure, you’ll acquire a higher level of expertise significantly quicker. Whereas you’ll get way less out of your deep dive if you spread it across many months, even if you spend the same amount of time studying.
Pradeep suggests condensing your deep dive into days. At most, into a week.
Also, remember that you can do more than one deep dive! As Pradeep put it, your first deep dive will probably have you feeling lost and/or overwhelmed. Your second and third deep dives will take less time. And you’ll gain true mental clarity by the fourth or fifth deep dive.
Figuring out execution
Pradeep pointed out in this blog that the work doesn’t end at the output of your deep dive — your database/model book. Instead, another challenge awaits:
“Once you[’ve done] a deep dive and you master a pattern[, the] next challenge is to execute it in [the] real market environment.
“This requires innovation and process flows.
“You try one way of doing it[, and] if that does not work, you try another way [— until] you find [a] way to do it.
“Process hacking is how humans develop ways to make things work.”
This is laborious work
Deliberately so. If everyone was prepared to do this, everyone would be banking. Instead, we have the infamous statistic that 95% of traders fail.
Few people excel in any field. But in trading, failing to excel means you’re losing money.
The deep dive exercise is a prerequisite to becoming a profitable trader. Period. It’s the deliberate practice traders need to master their field.
You can find equivalents in other fields. For instance, my priority is to become the best writer I can be. (I put trading second. And yes, I know that will prevent me from becoming a trading champion. I’m okay with that.)
I currently write around 100,000 words a month. I consider this a vital component of my training programme. Without putting in the reps, you can’t cultivate intuition.
I know few writers who do the same.
But when you focus on putting in the hard work consistently, talent becomes irrelevant. The real question is:
Can you stick with it for long enough to become great at it?
Support my work
Found this stack valuable? If you’d like to contribute financially to say thank you, please buy me a coffee.
You can also help out by liking, commenting on and/or sharing this stack. They all help spread the word!
Listen to this stack
More content like this


The Trading Resource Hub’s full archive is here.
Great content, keep up the good work
great work 🚀🚀🚀