
Martin Luk’s Low-Friction Study Process
From high-level pattern to precise execution: a shorting case study

In spring last year, Martin Luk and I wanted to put together a new stack after the success of his first guest post:

His thread on shorting sparked the idea for this stack: not giving you fish, but teaching you how to catch them yourself. In other words…
Martin would share his study process while still fresh on his mind.
He put together an incomplete draft in April 2025. I then reviewed the document, pointing out areas that could be fleshed out or clarified, but we ran into hiccups.
Martin got very busy straight after his TraderLion appearance. When things calmed down for him, I had other priorities. Furthermore, I didn’t know that Martin would bring up Brian Shannon in his stack, putting me in an awkward position.
At the time, I couldn’t tell Martin (or anyone else) that Brian had just become a ghostwriting client. But I also knew the secrecy was temporary. By waiting to publish, I didn’t just do what felt right as a ghostwriter — I’d also be able to add insights and context I’ve learnt from working with Brian.
That’s why Martin’s second guest post may feel a little odd timing-wise, but I promise you that it has timeless value, even if the examples are mostly from a year ago.
Also, Martin will be sharing his lessons from 2025 in a separate, future stack!As things turned out, delaying publication had the extra benefit of fitting into my ongoing study series as part 3.
Part 1 and part 2 were by Kohei Yamada (on backtesting) and Clement Ang (on model books), who both have more structured approaches in their study style, which their stacks reflected.
I’m not suggesting Martin isn’t data-driven. His insights on risk–reward alone demonstrate his clarity when it comes to numbers.
However, he does have a more intuitive approach when it comes to studying — and is a natural storyteller — which the style of this stack reflects. (I always look to bring out the best of any collaborator, not force them into a template.)
Perhaps that makes Martin’s methods harder to copy than Kohei’s or Clement’s — but that doesn’t mean we can’t learn from them.
The biggest thing that struck me is Martin’s simple, low-friction method of a deep dive.
This low-friction approach resonates. I’m a big advocate for just getting started imperfectly, then refining as you go along.
You can get exceptional results if you stick with an imperfect process for long enough, rather than pursue the perfect process you can’t consistently implement. Plus, you’ll naturally make tweaks to that process as you go along. Because by acting, you gather feedback. What works? What doesn’t?
But all momentum — and meaningful improvement — starts with action. Build the habit first.
This ‘momentum-first’ mindset is particularly effective when combined with specificity.
This comes back to nuanced simplicity, where you have a deep grasp of the foundation that guides you, then let everything else flow from that.
In the case of Martin’s study method, his focus is the core question he’s trying to answer — and he keeps the process of finding his solution as simple as possible.
𝐈𝐍 𝐓𝐇𝐈𝐒 𝐒𝐓𝐀𝐂𝐊
Part 1: How Martin Luk does a deep dive
Part 2: Q&A follow-up
Part 3: Kyna’s takeaways
Every guest receives my full writing and editing support, but all ideas are their own.
PART 1: HOW MARTIN LUK DOES A DEEP DIVE
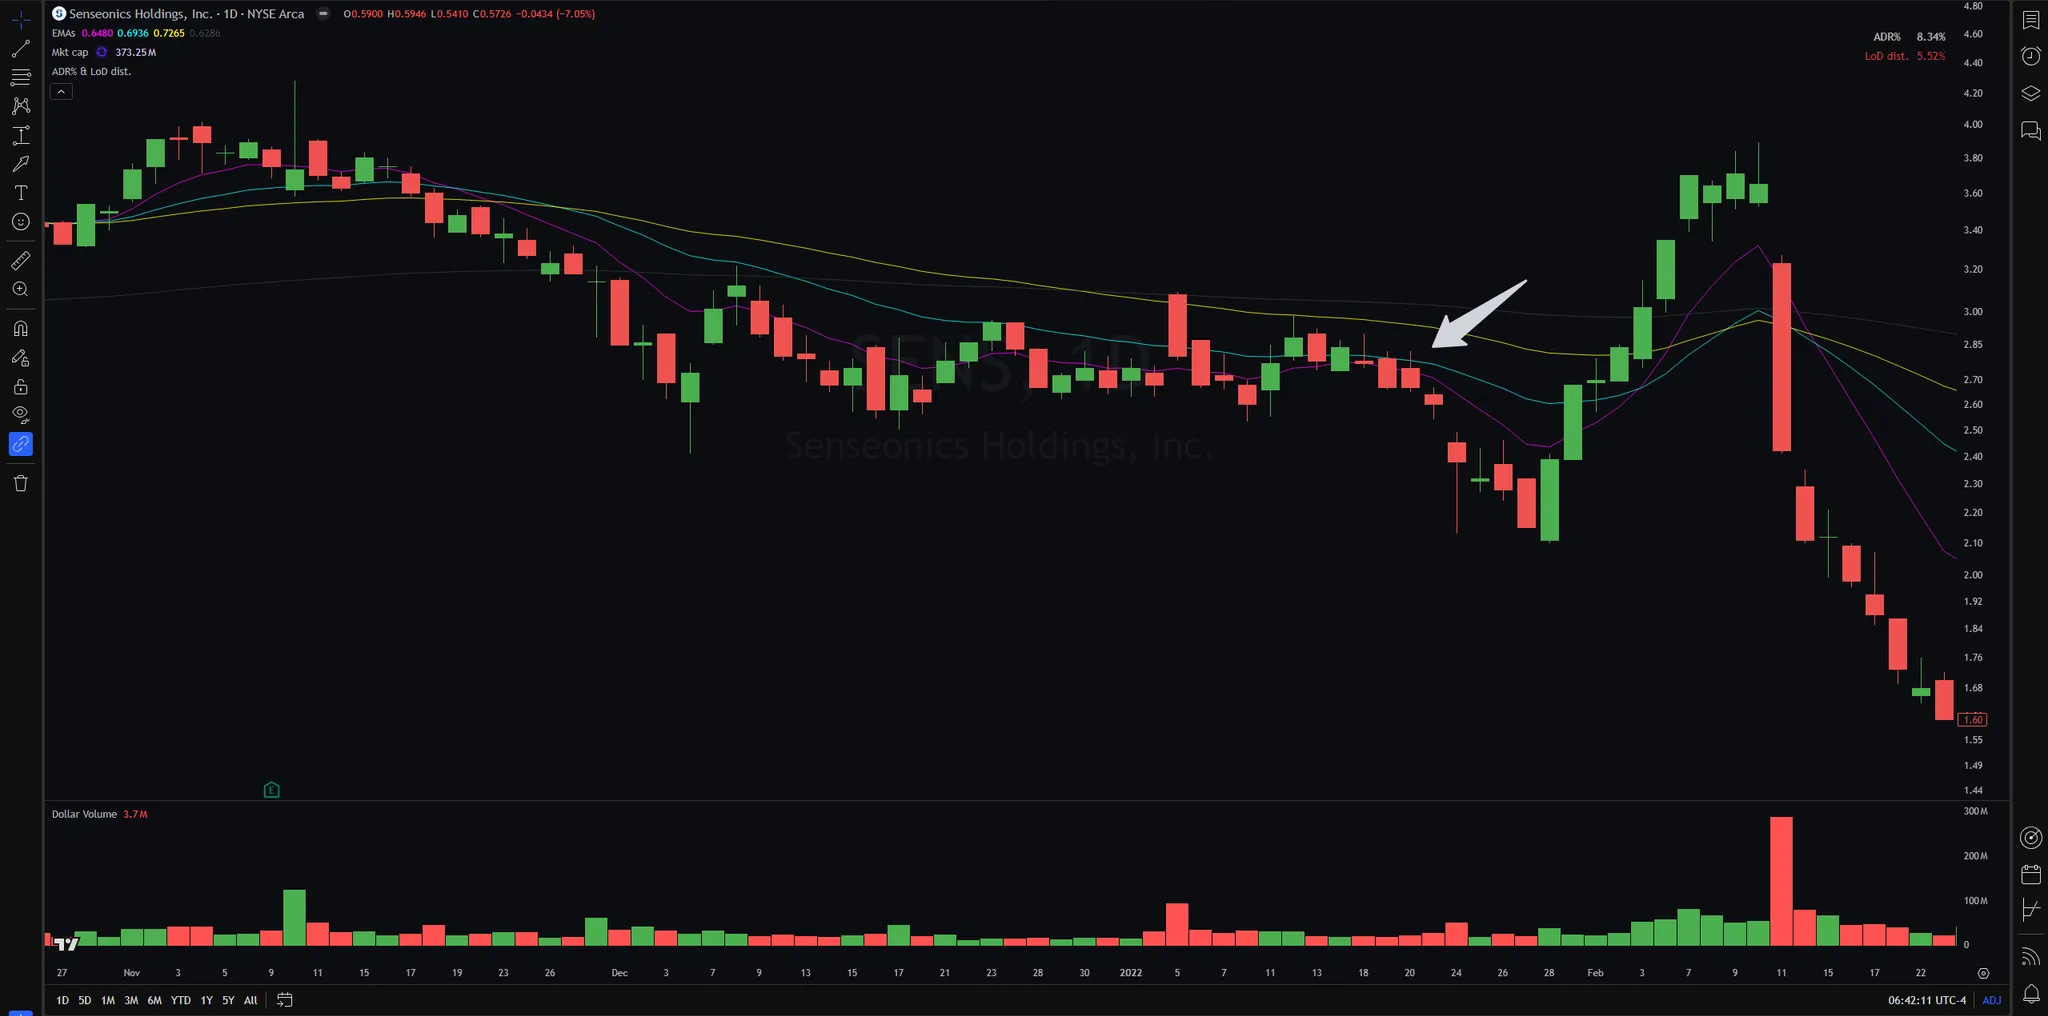
Late December 2024, the market was whispering to me.
The signs were unsettling. Alarming, even.
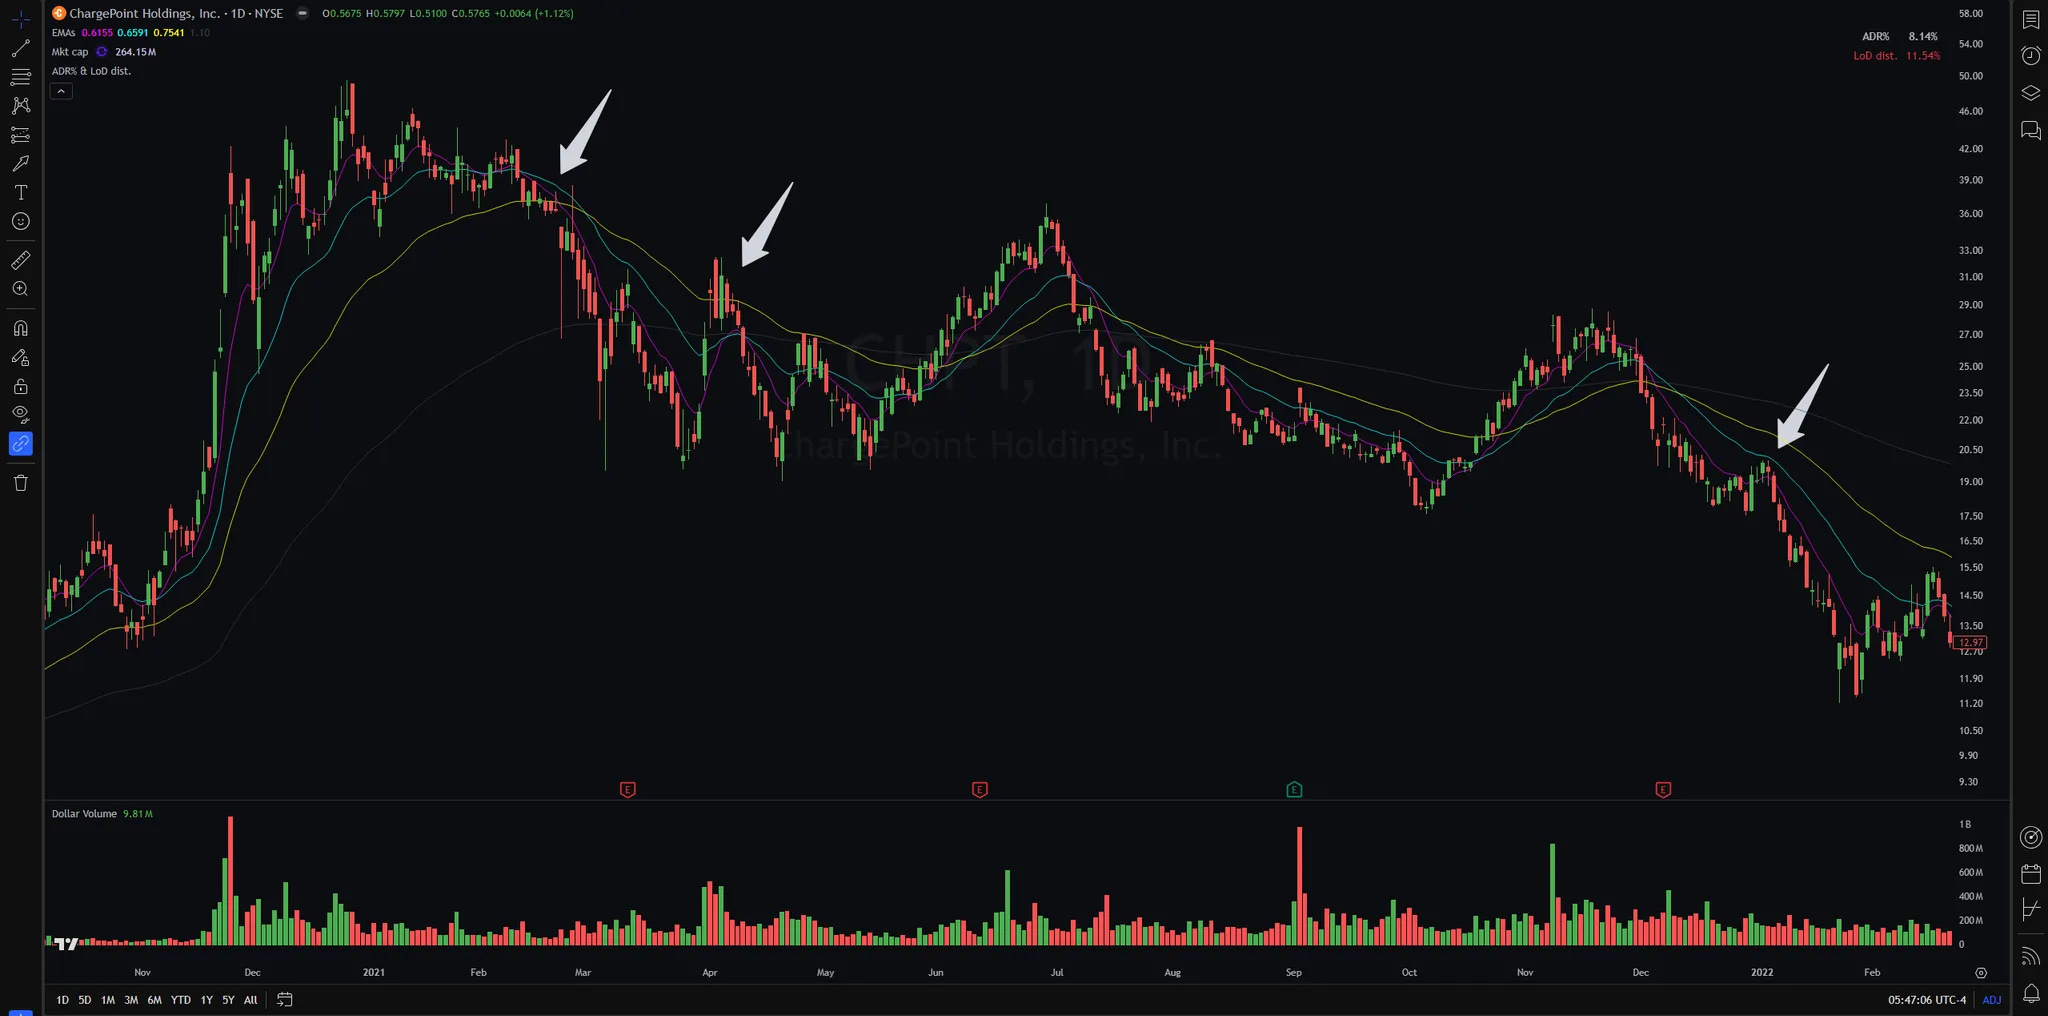
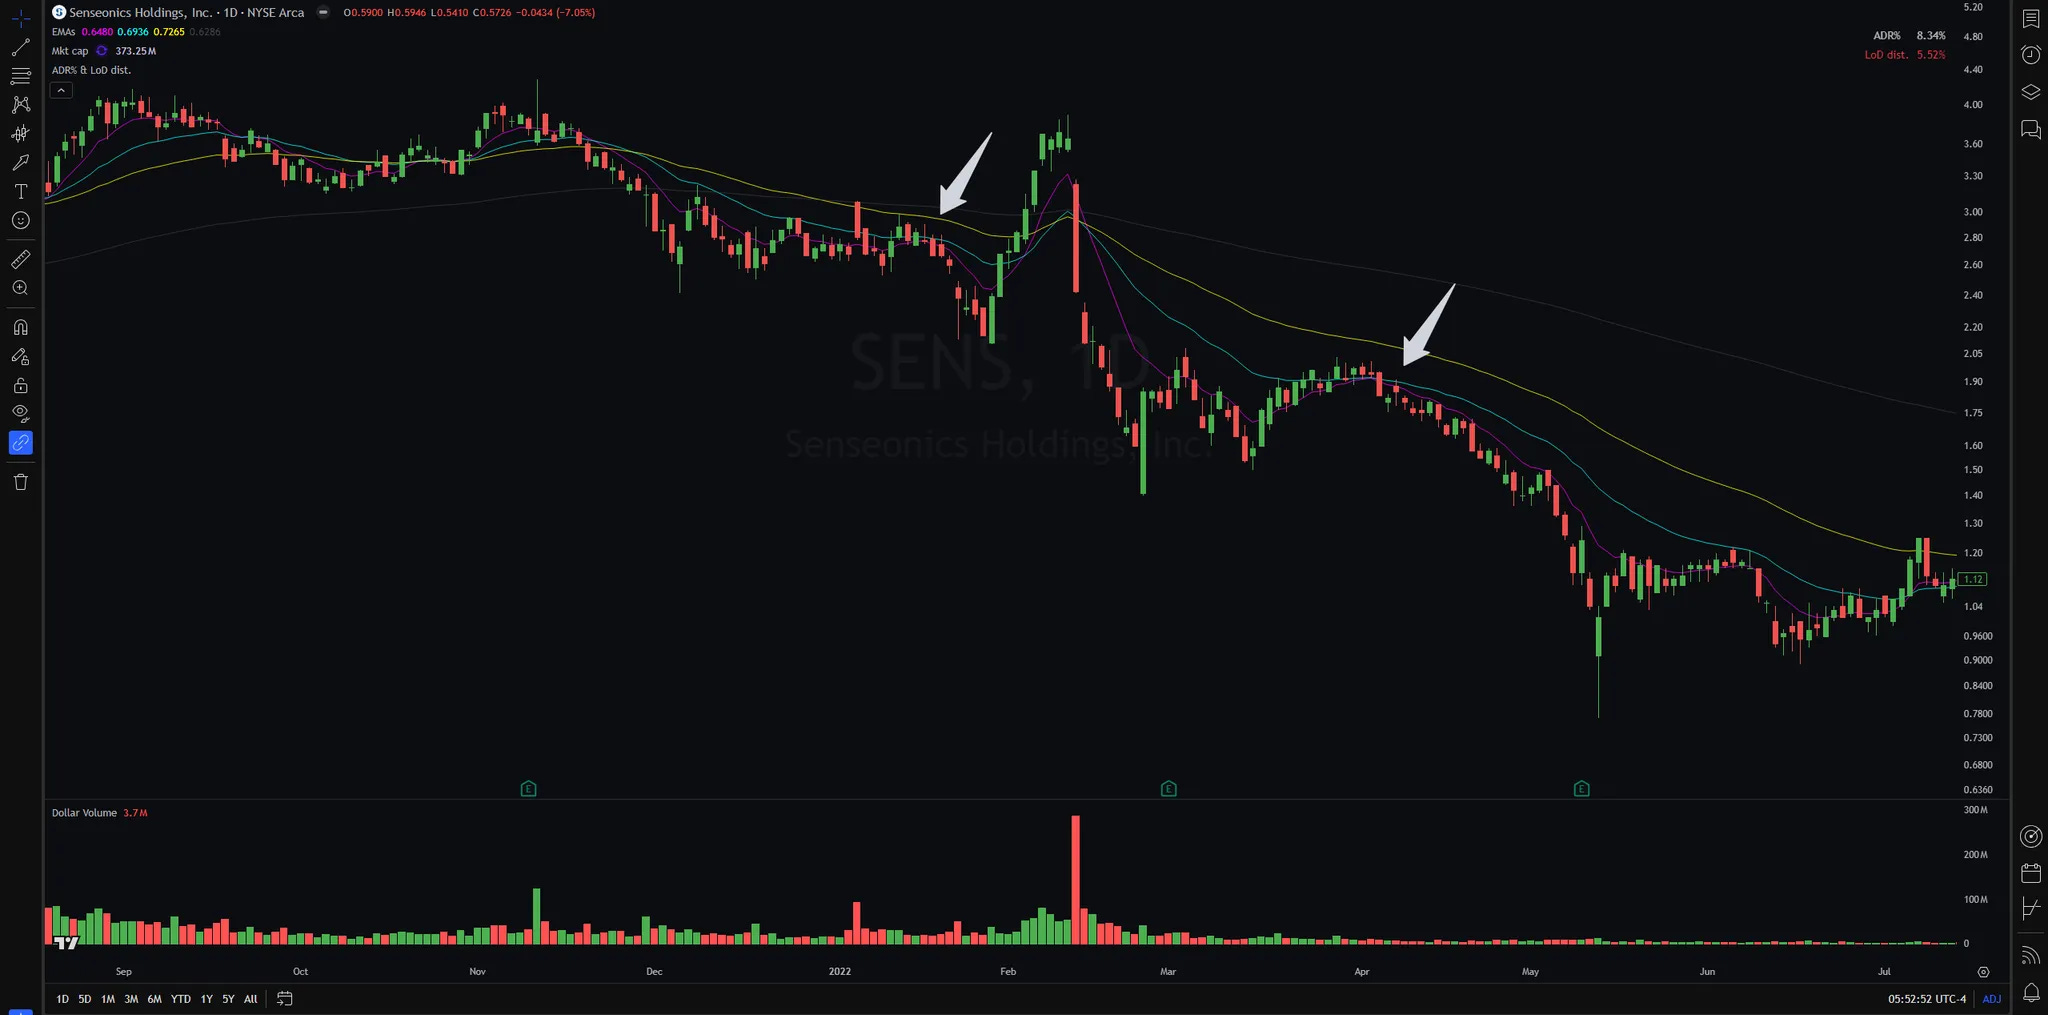
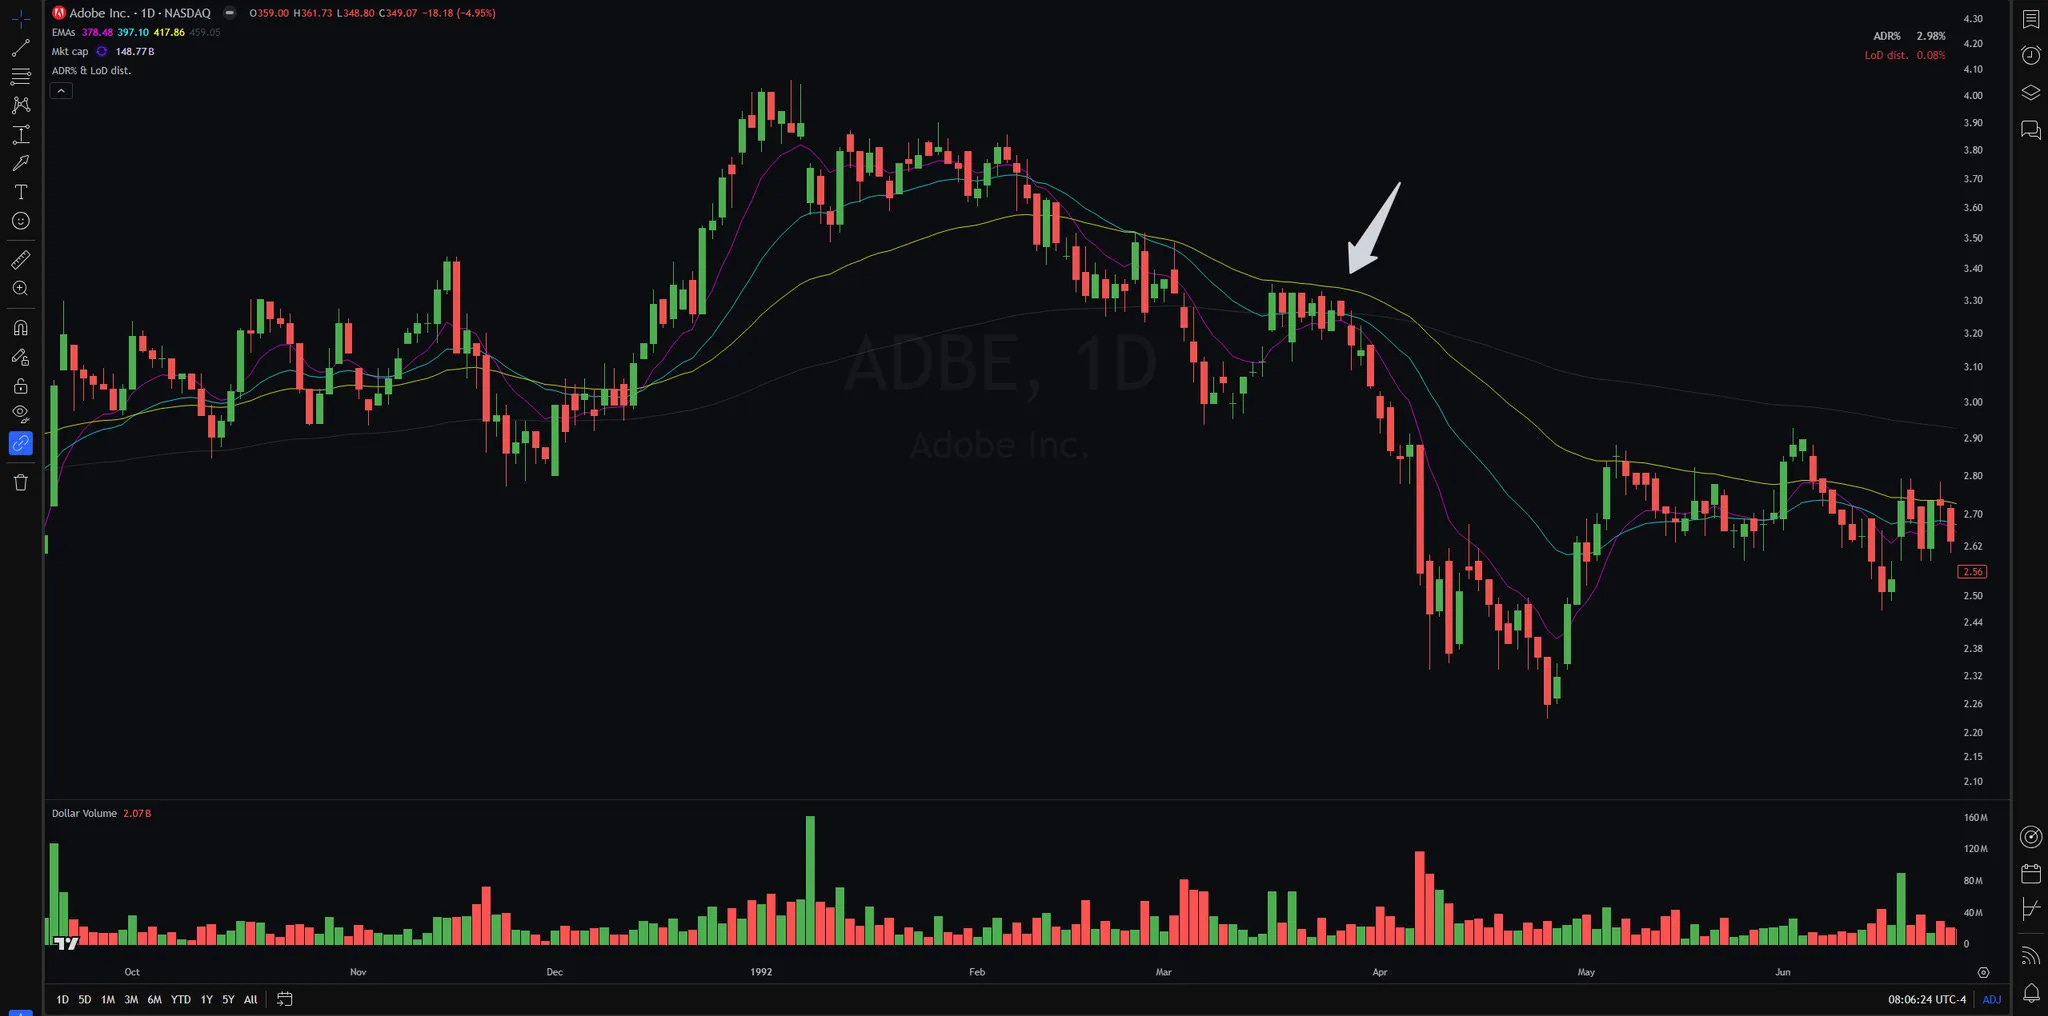
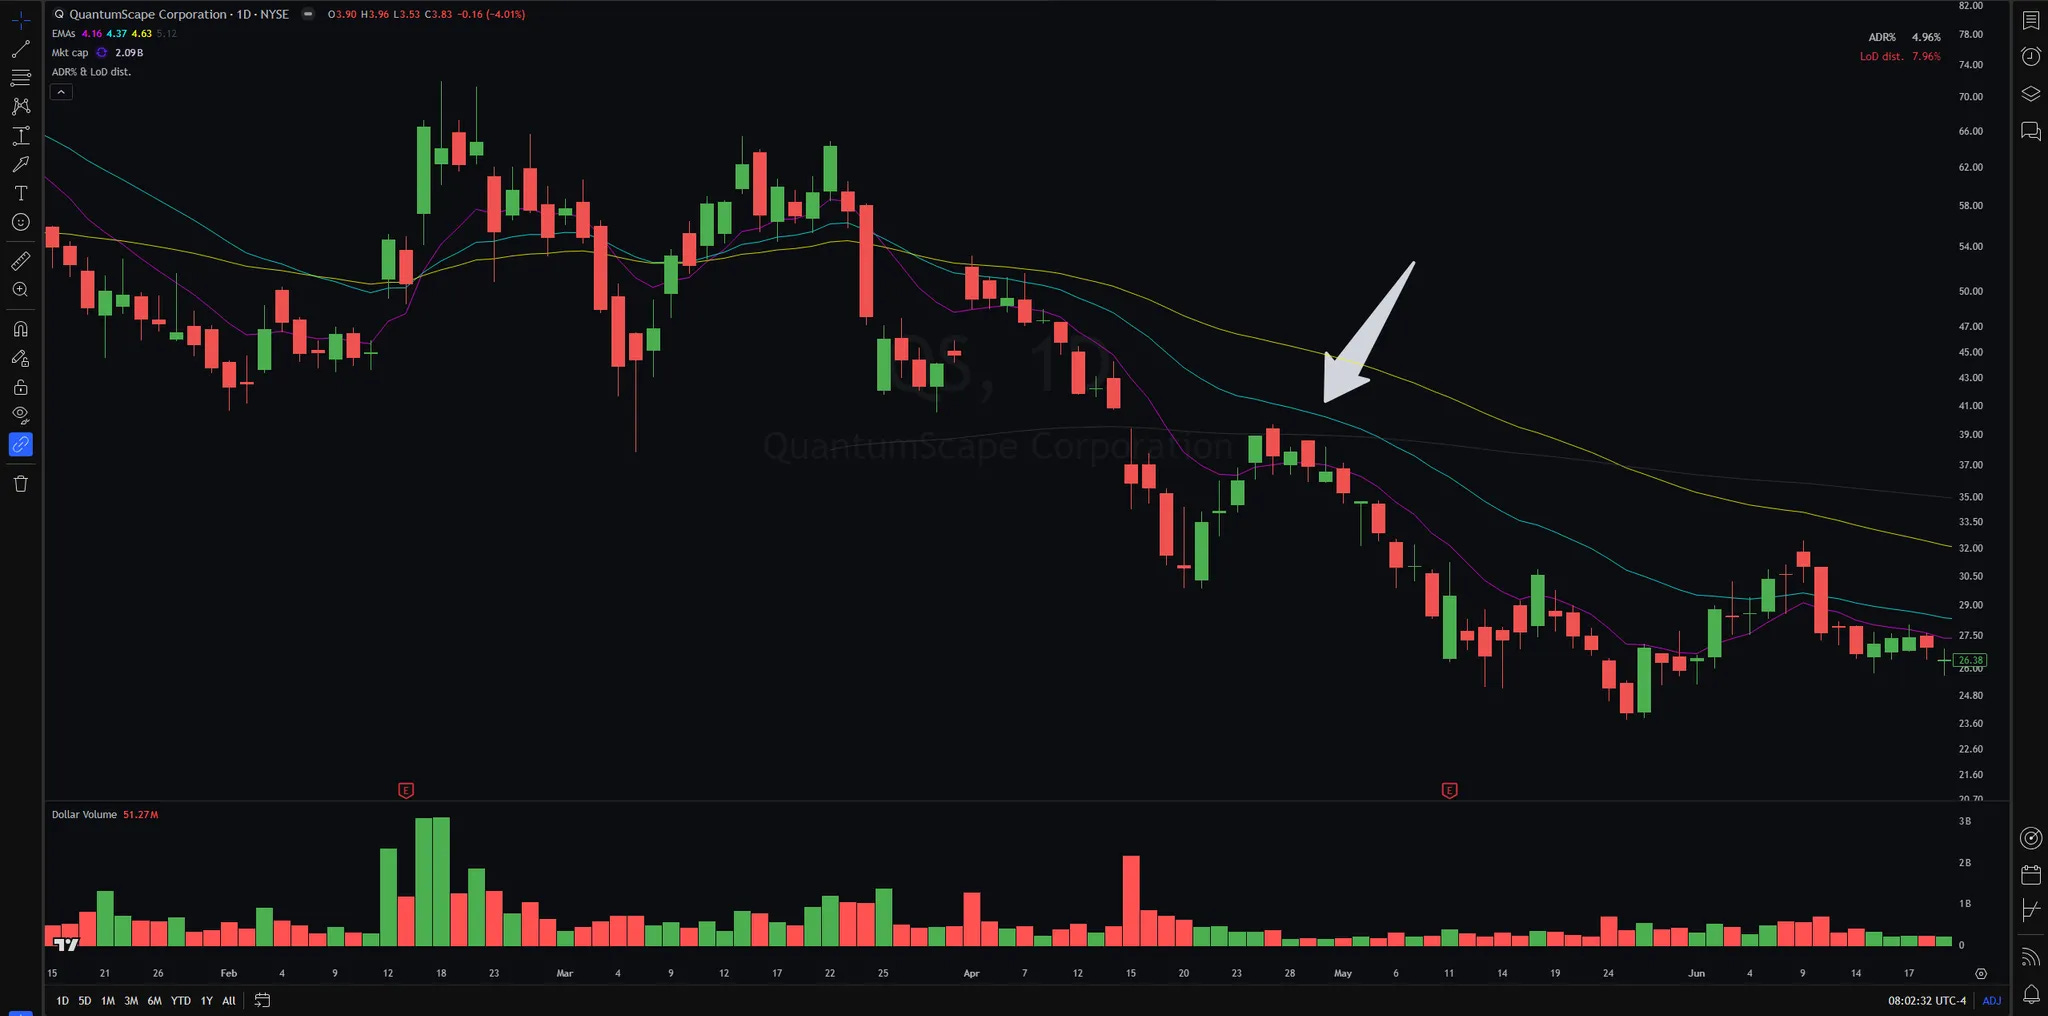
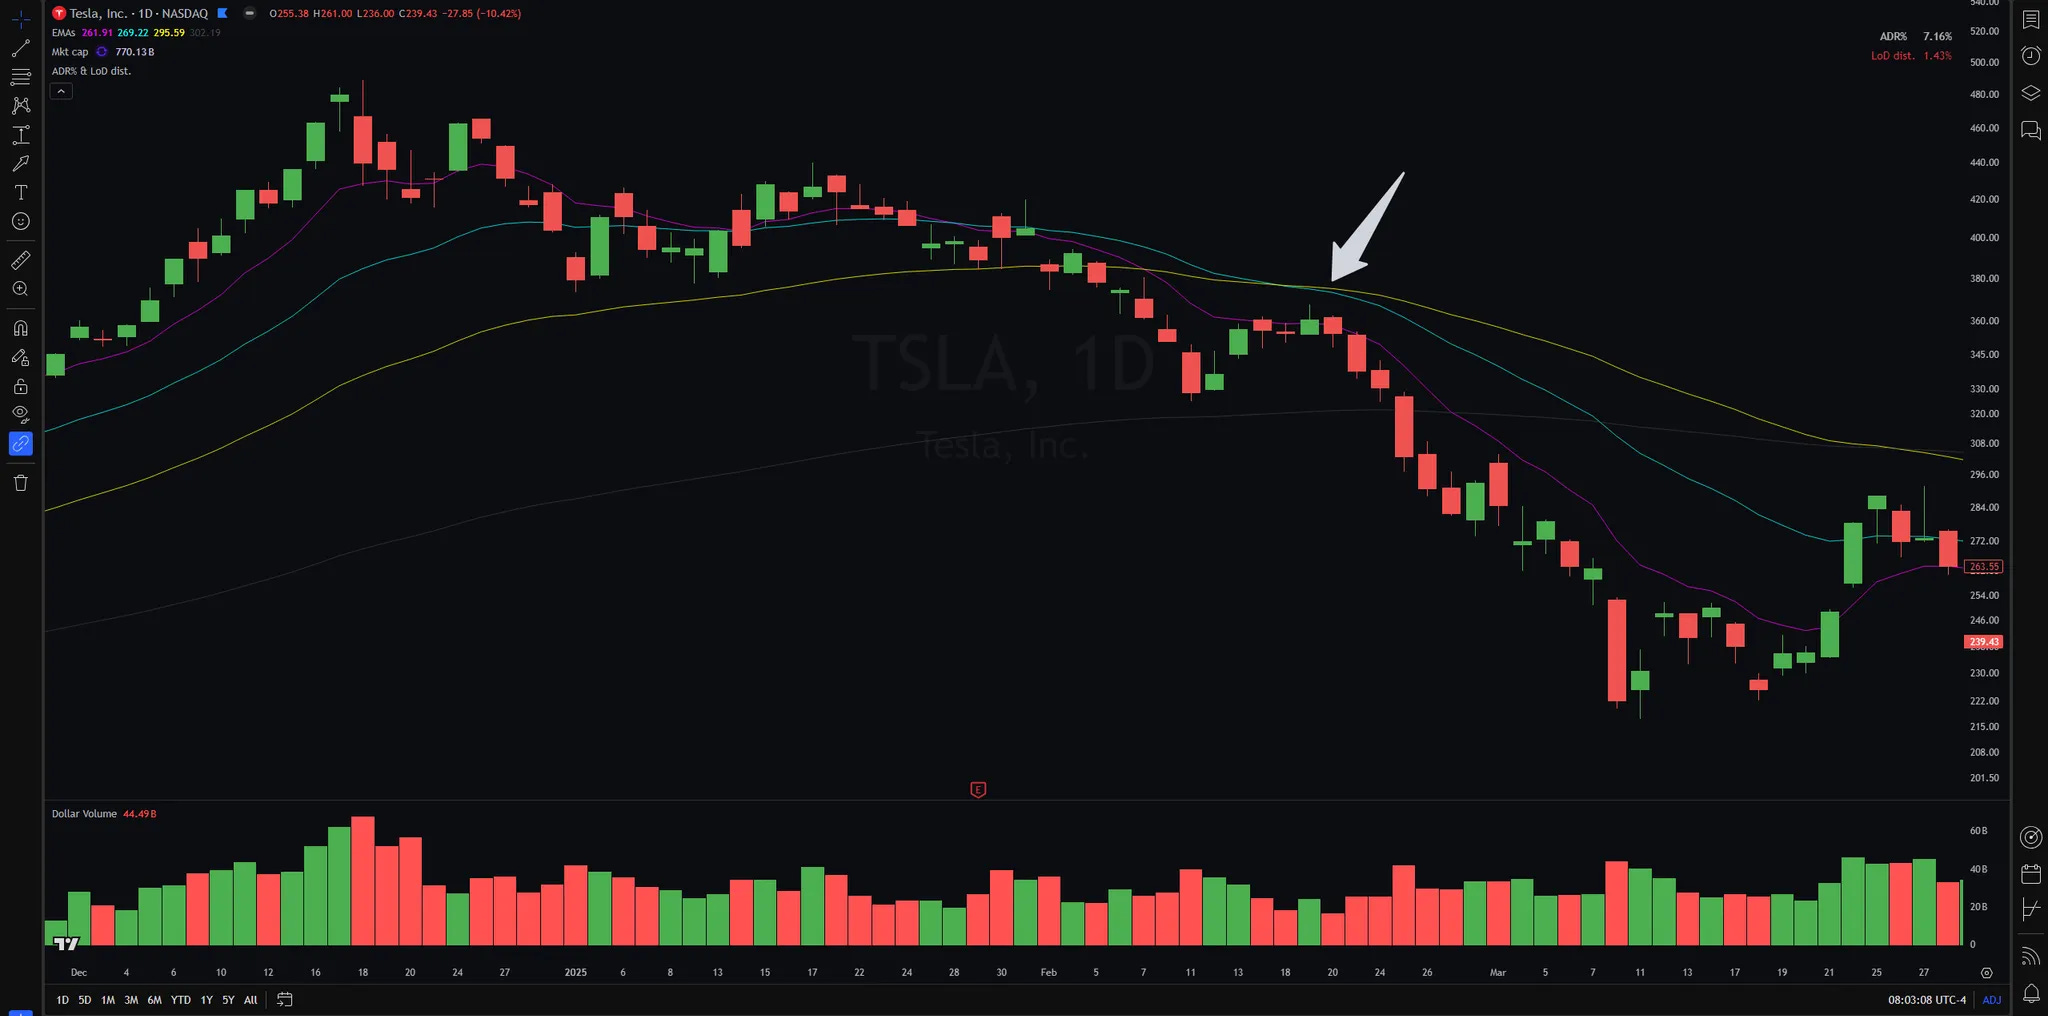
More and more breakouts were failing. Stocks were losing key moving averages:
As the market had been edging up since January 2023 without a deep correction and the market sentiment remained overwhelmingly positive, I believed a correction was likely around the corner.
However, during the 2022 bear market, I only returned 8% — nearly all my short attempts failed.
This single-digit return wasn’t satisfactory.
Knowing that I tend to overtrade and struggle to sit out during corrections, I had to improve my shorting skills to avoid incurring unnecessary losses again.
As I honed many trading skills by studying charts, I took the same approach this time.
One thing I really like about studying charts is the ease of access.
Simply type the ticker. Press a few keys on your keyboard. That’s all it takes.
(This is why I ignore financial metrics when I study EPs — I find it too time-consuming to obtain and analyse the data.)
I decided to start from the 2022 bear market.
Having experienced the decline first hand, I was already familiar with some of the names that suffered significant downturns.
So, I simply typed in tickers, then:
Studied every downtrend the stock made from beginning to end; and
Asked myself where a good risk–reward entry could be if I were trading in hindsight. This is especially important with shorts, which are mathematically less favourable than longs.

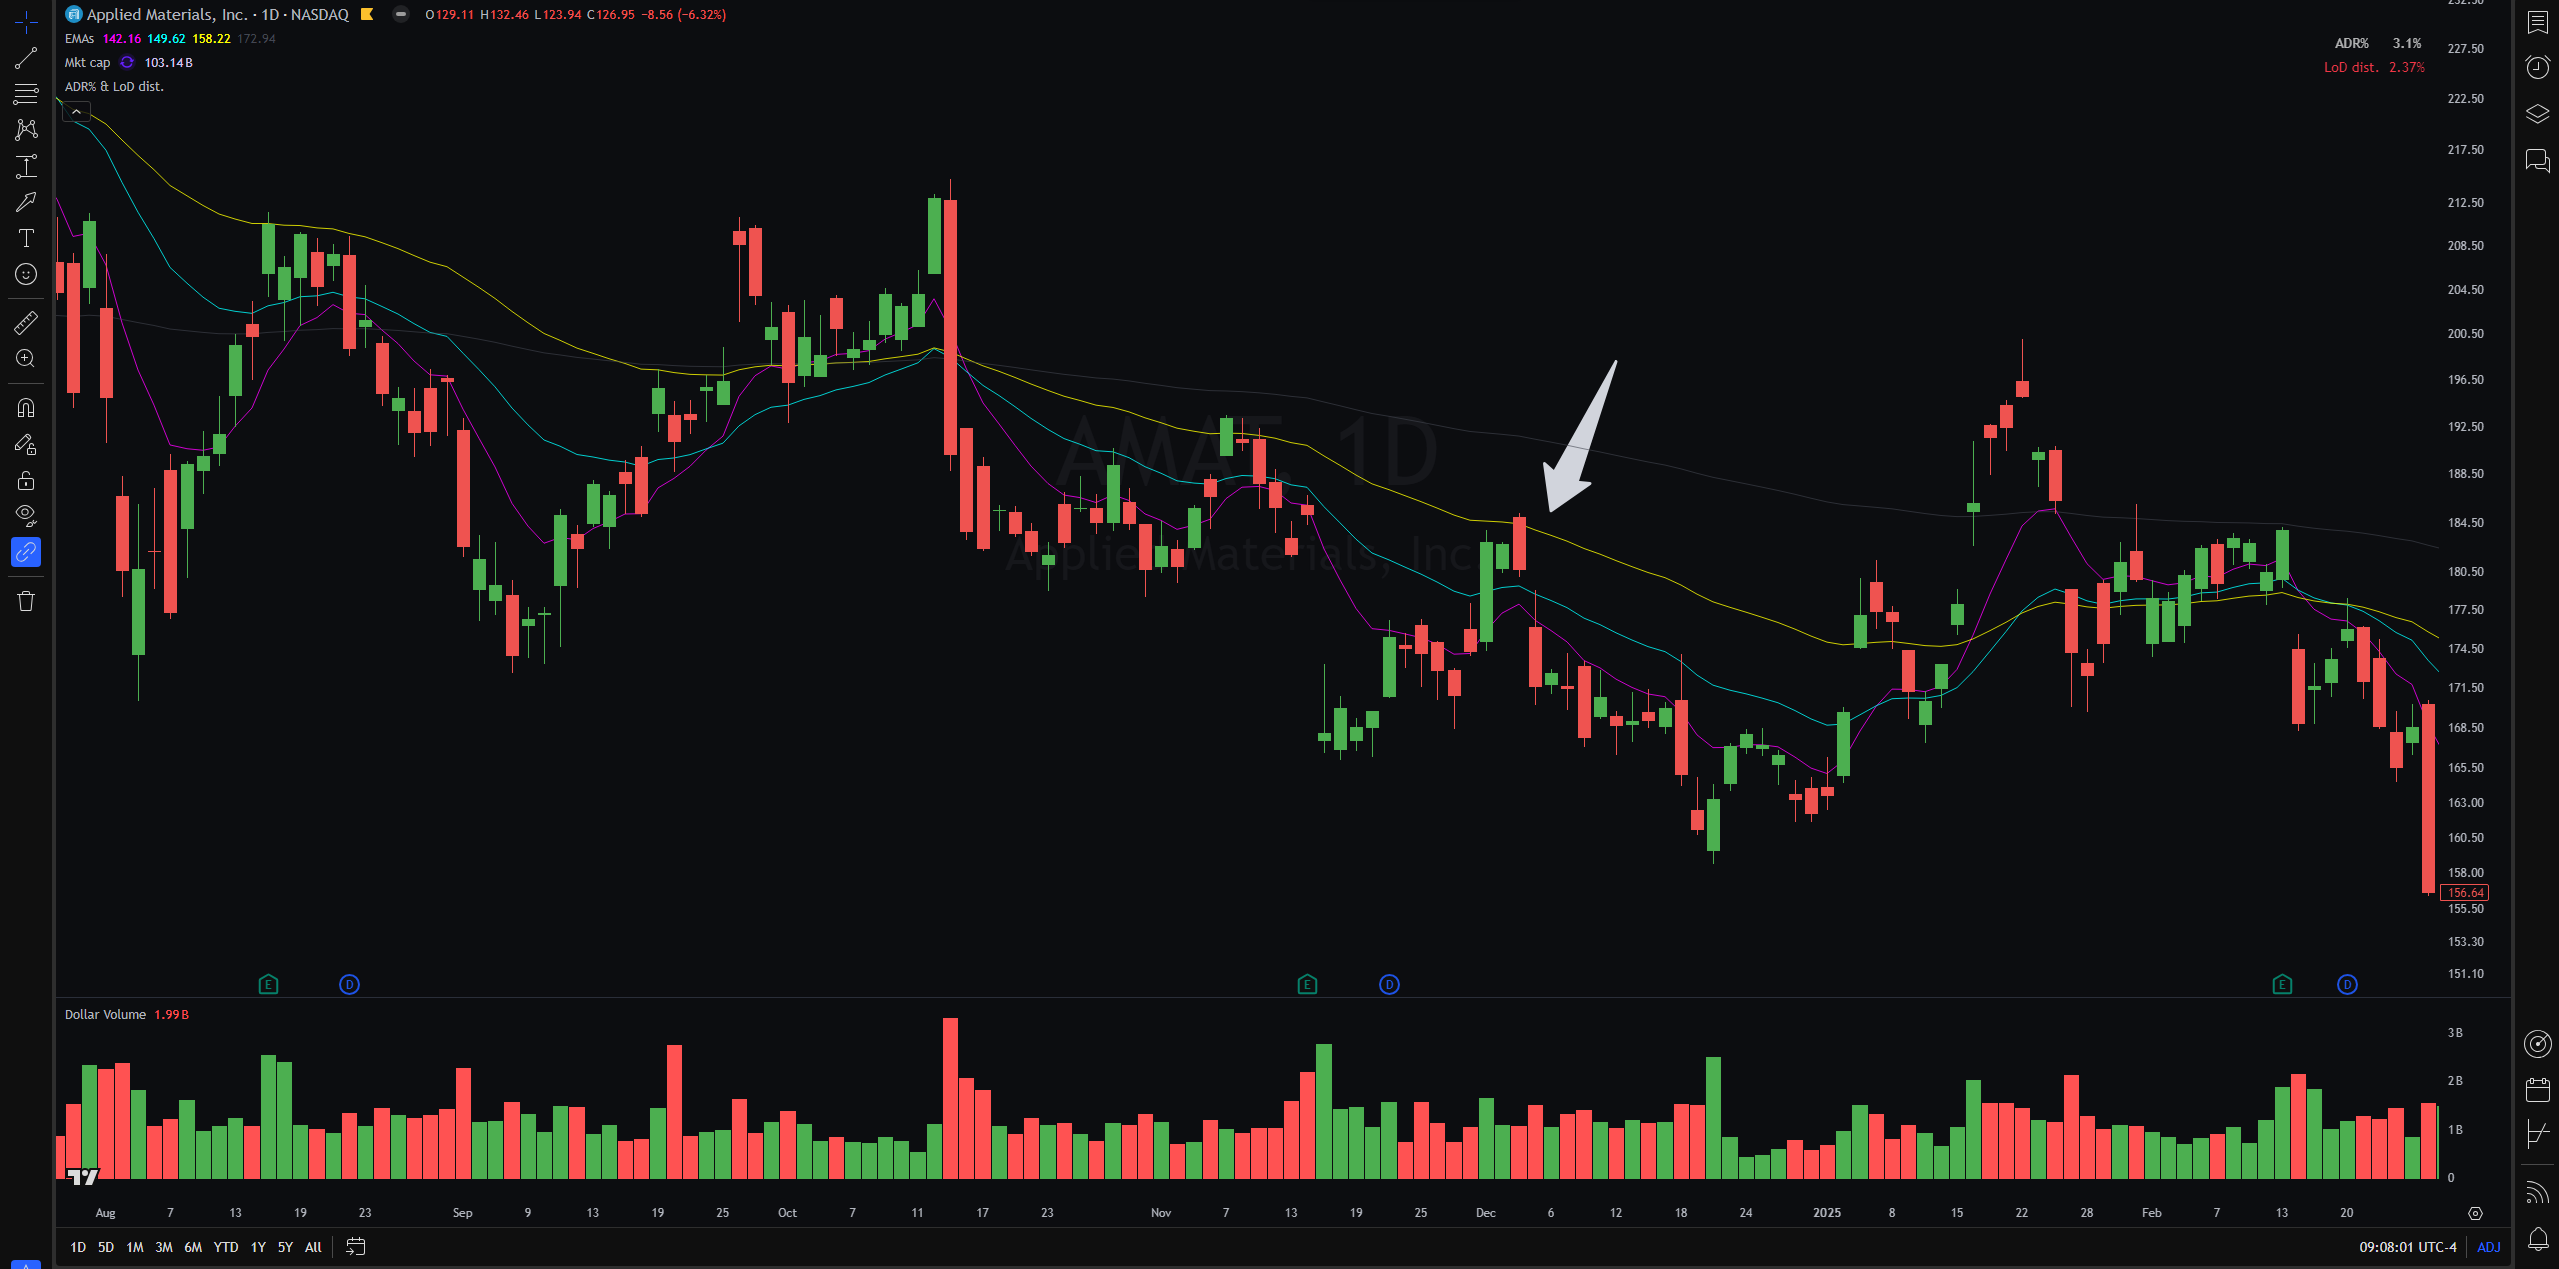
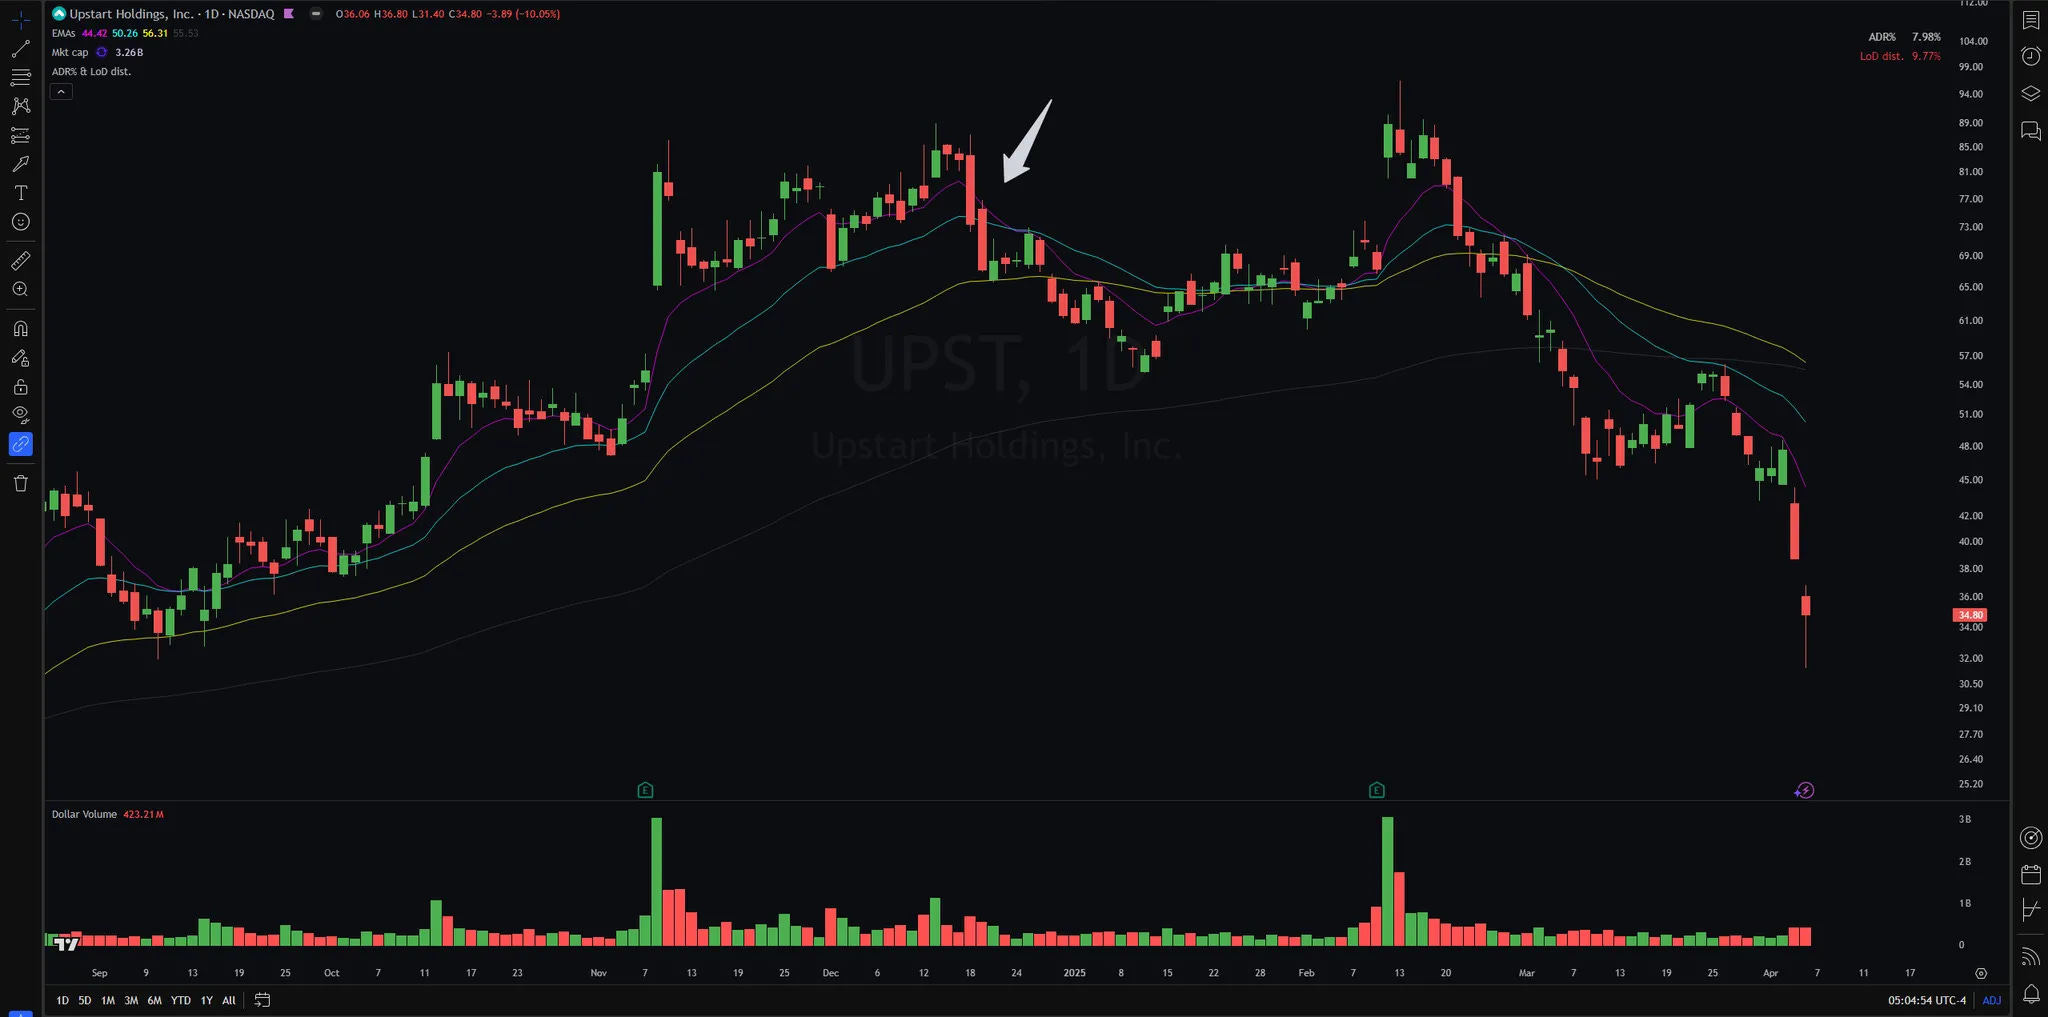
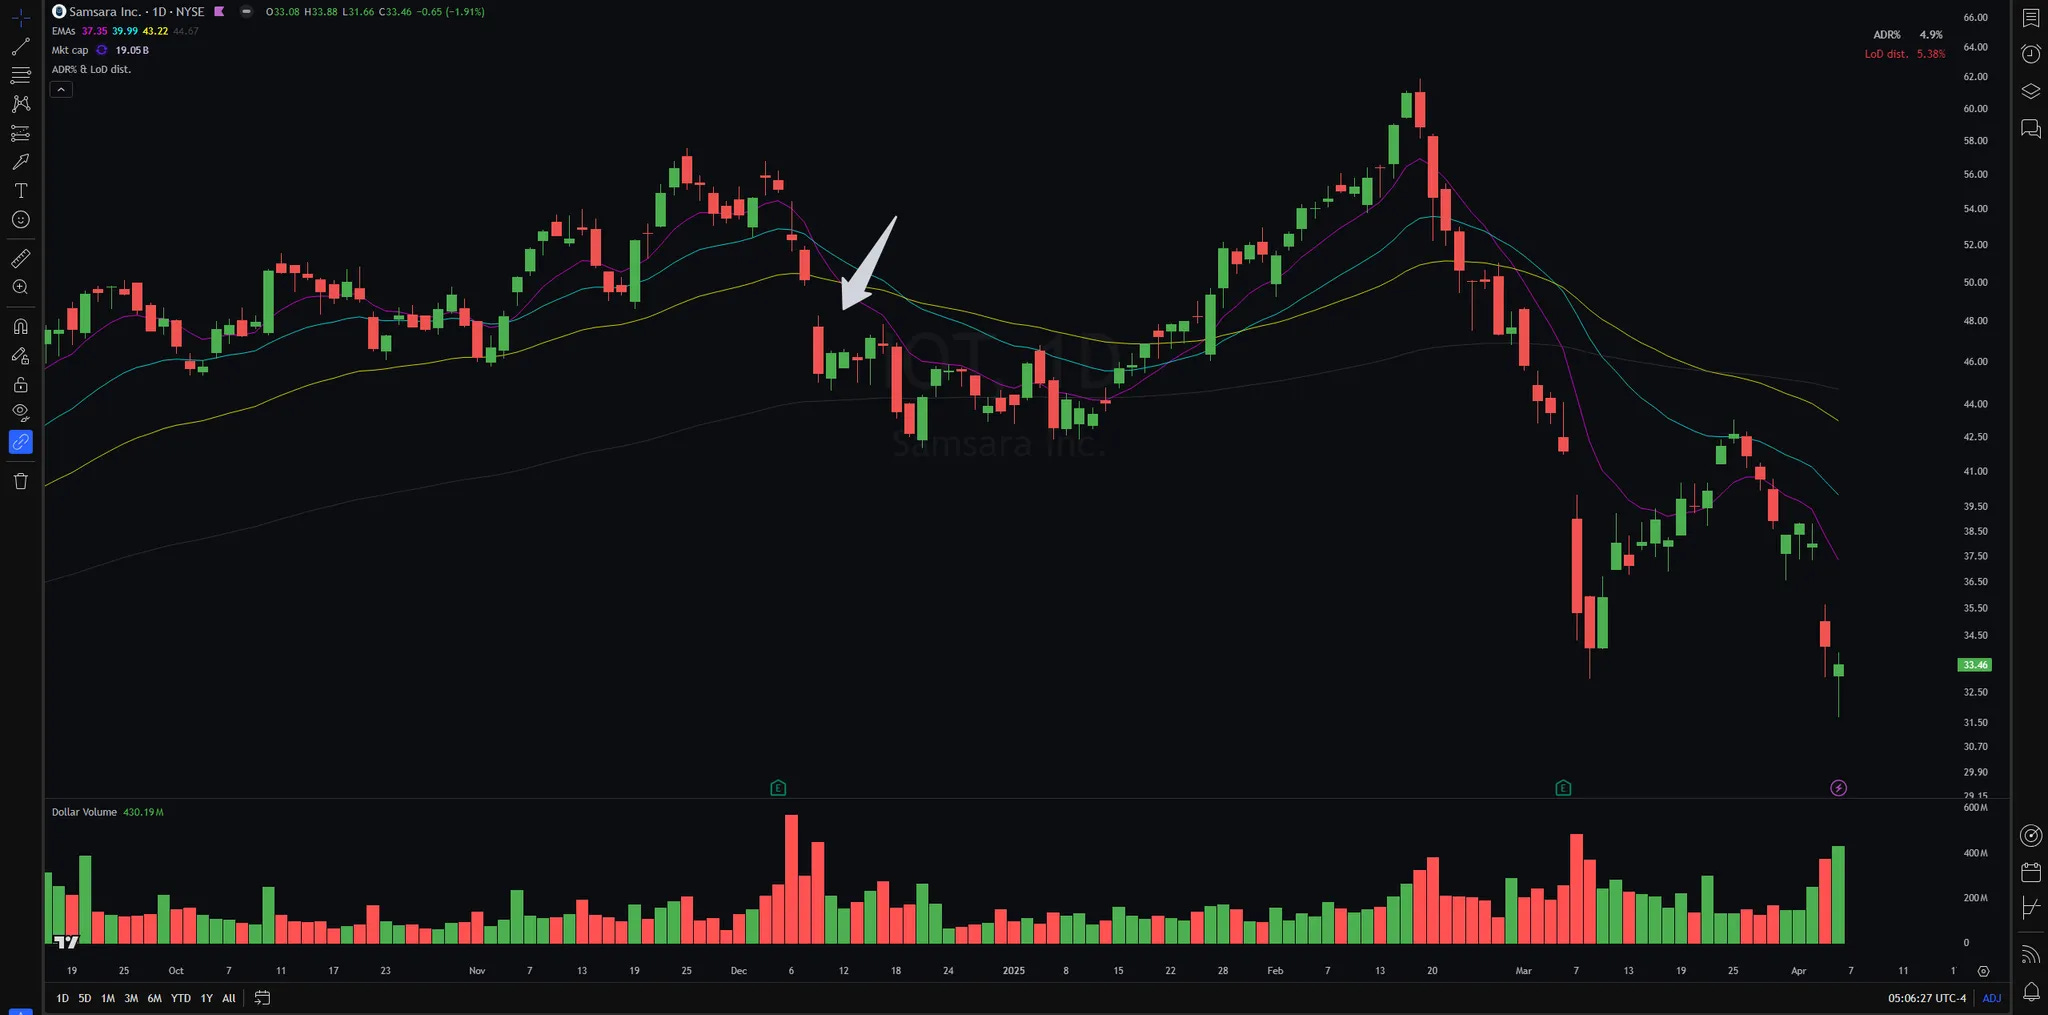
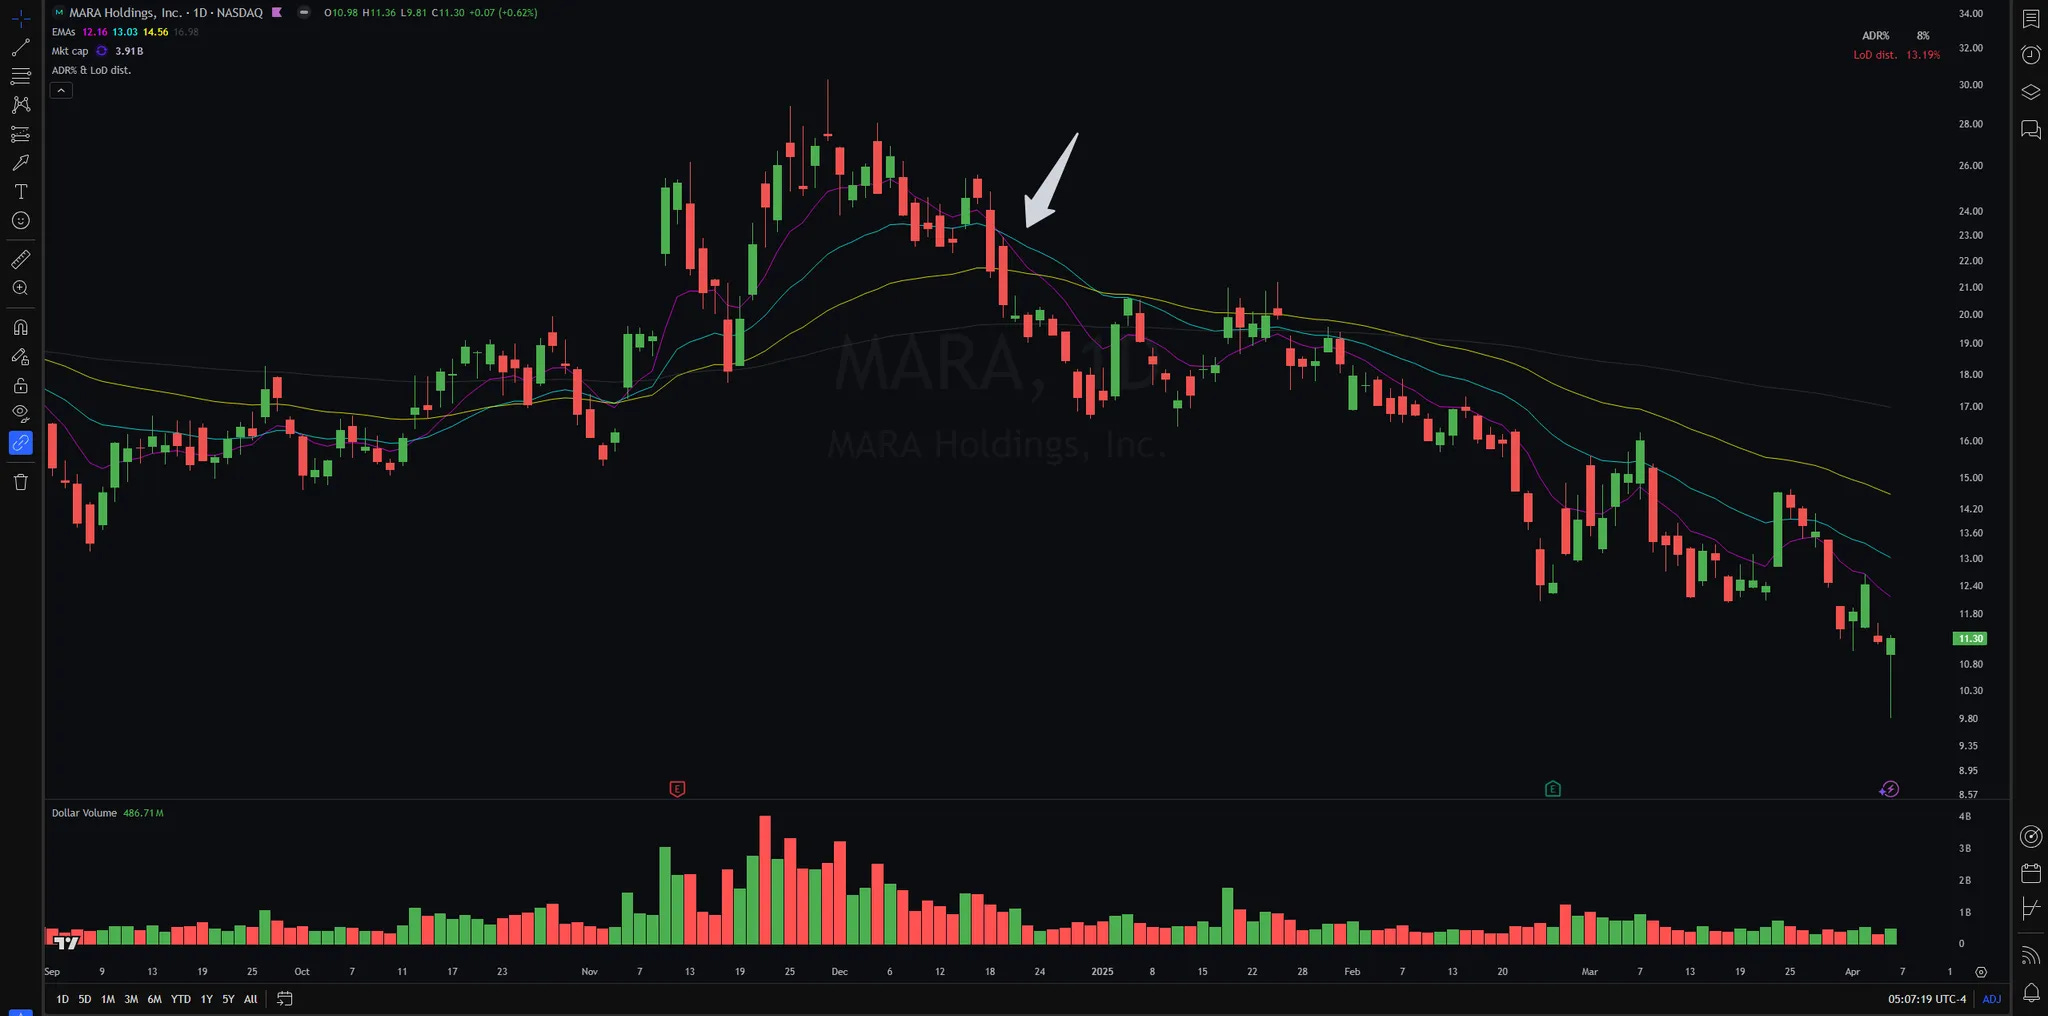
After flipping just a few charts, I already started noticing a pattern:
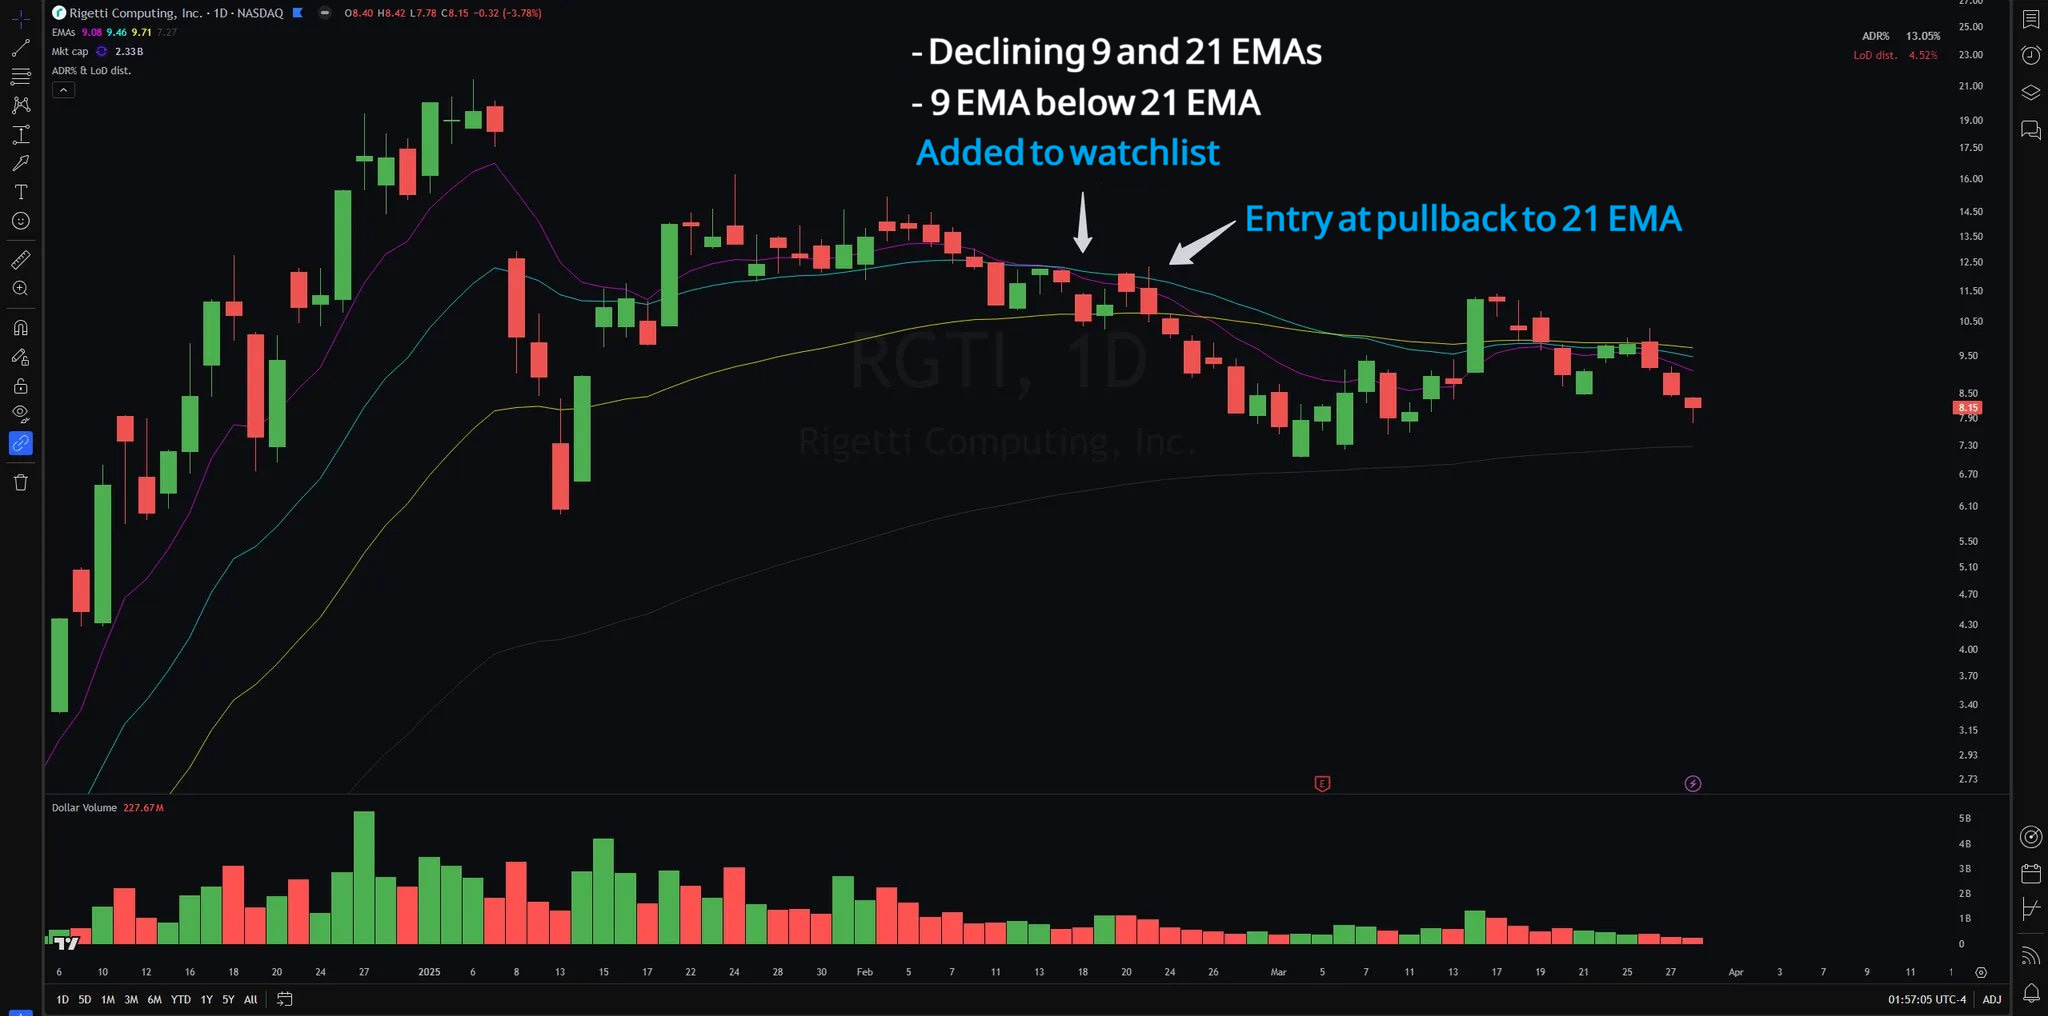
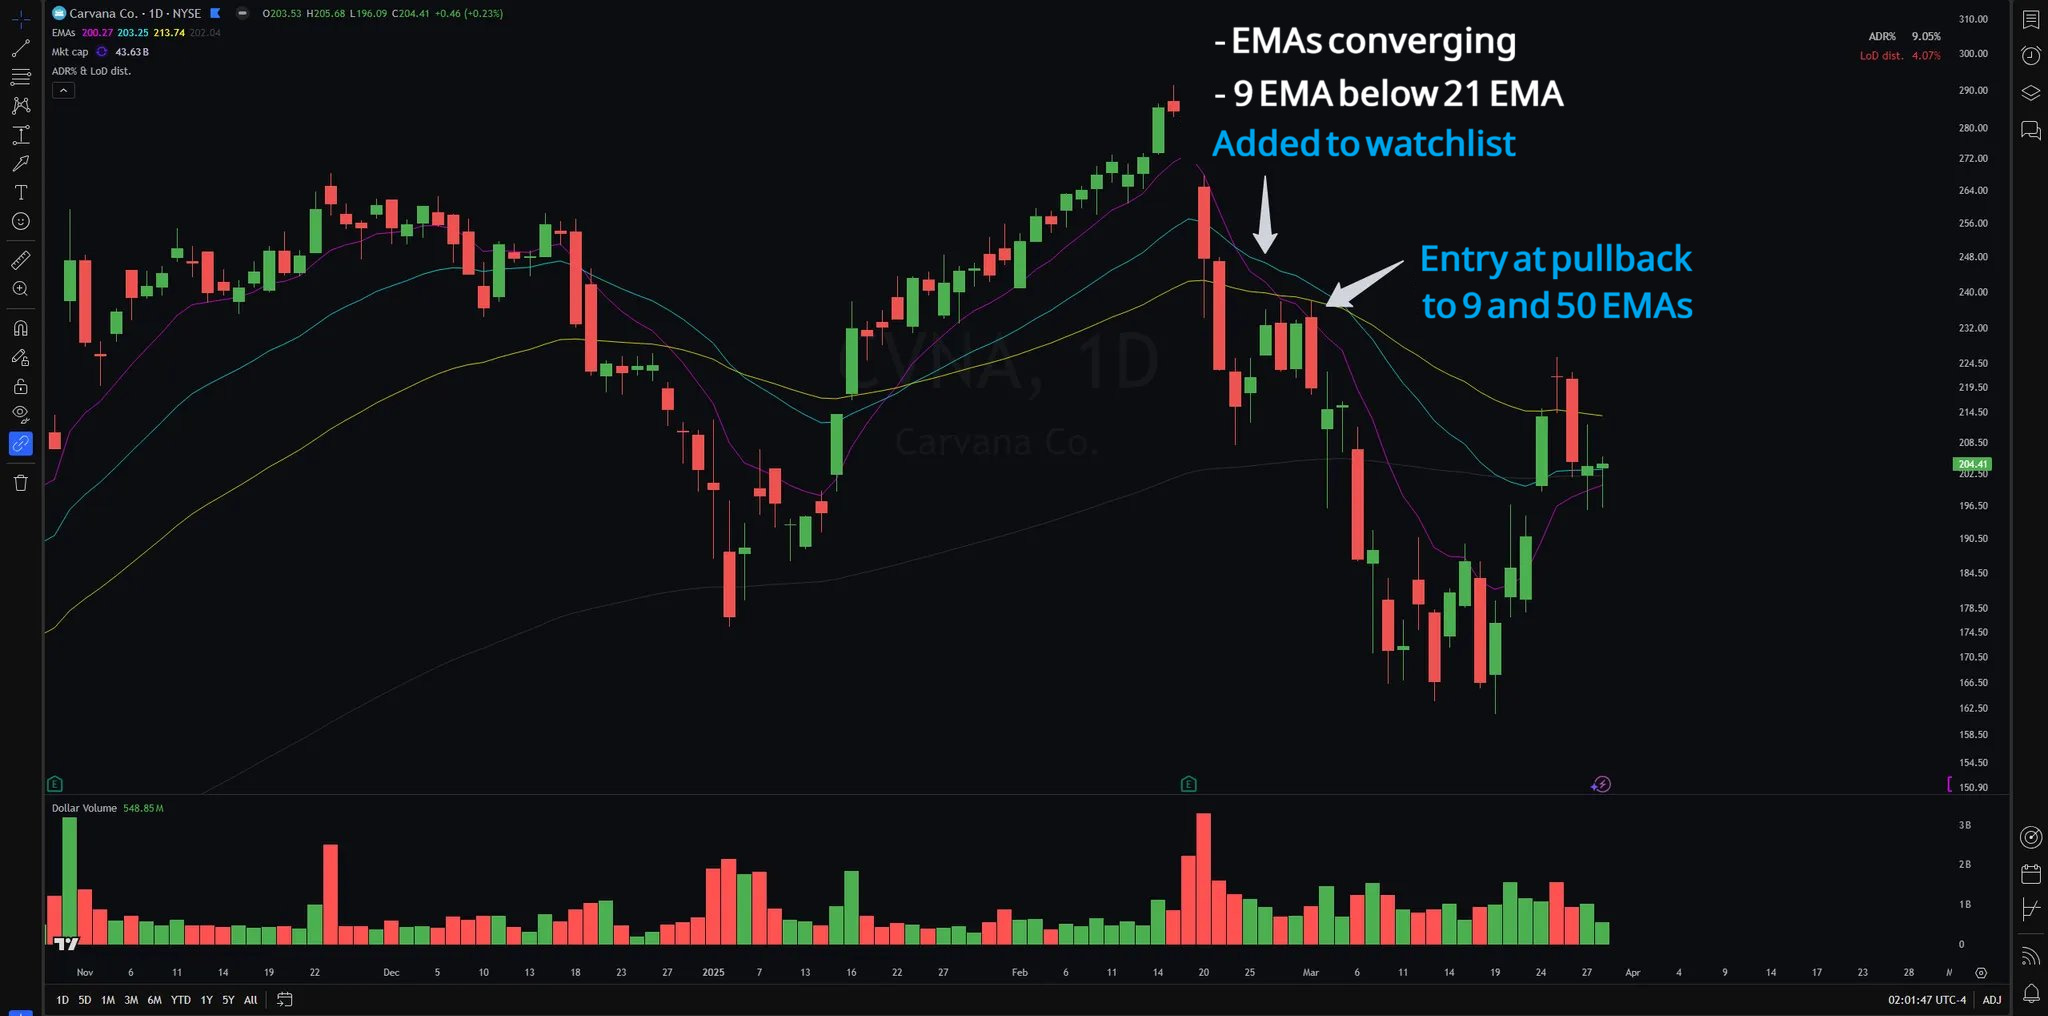
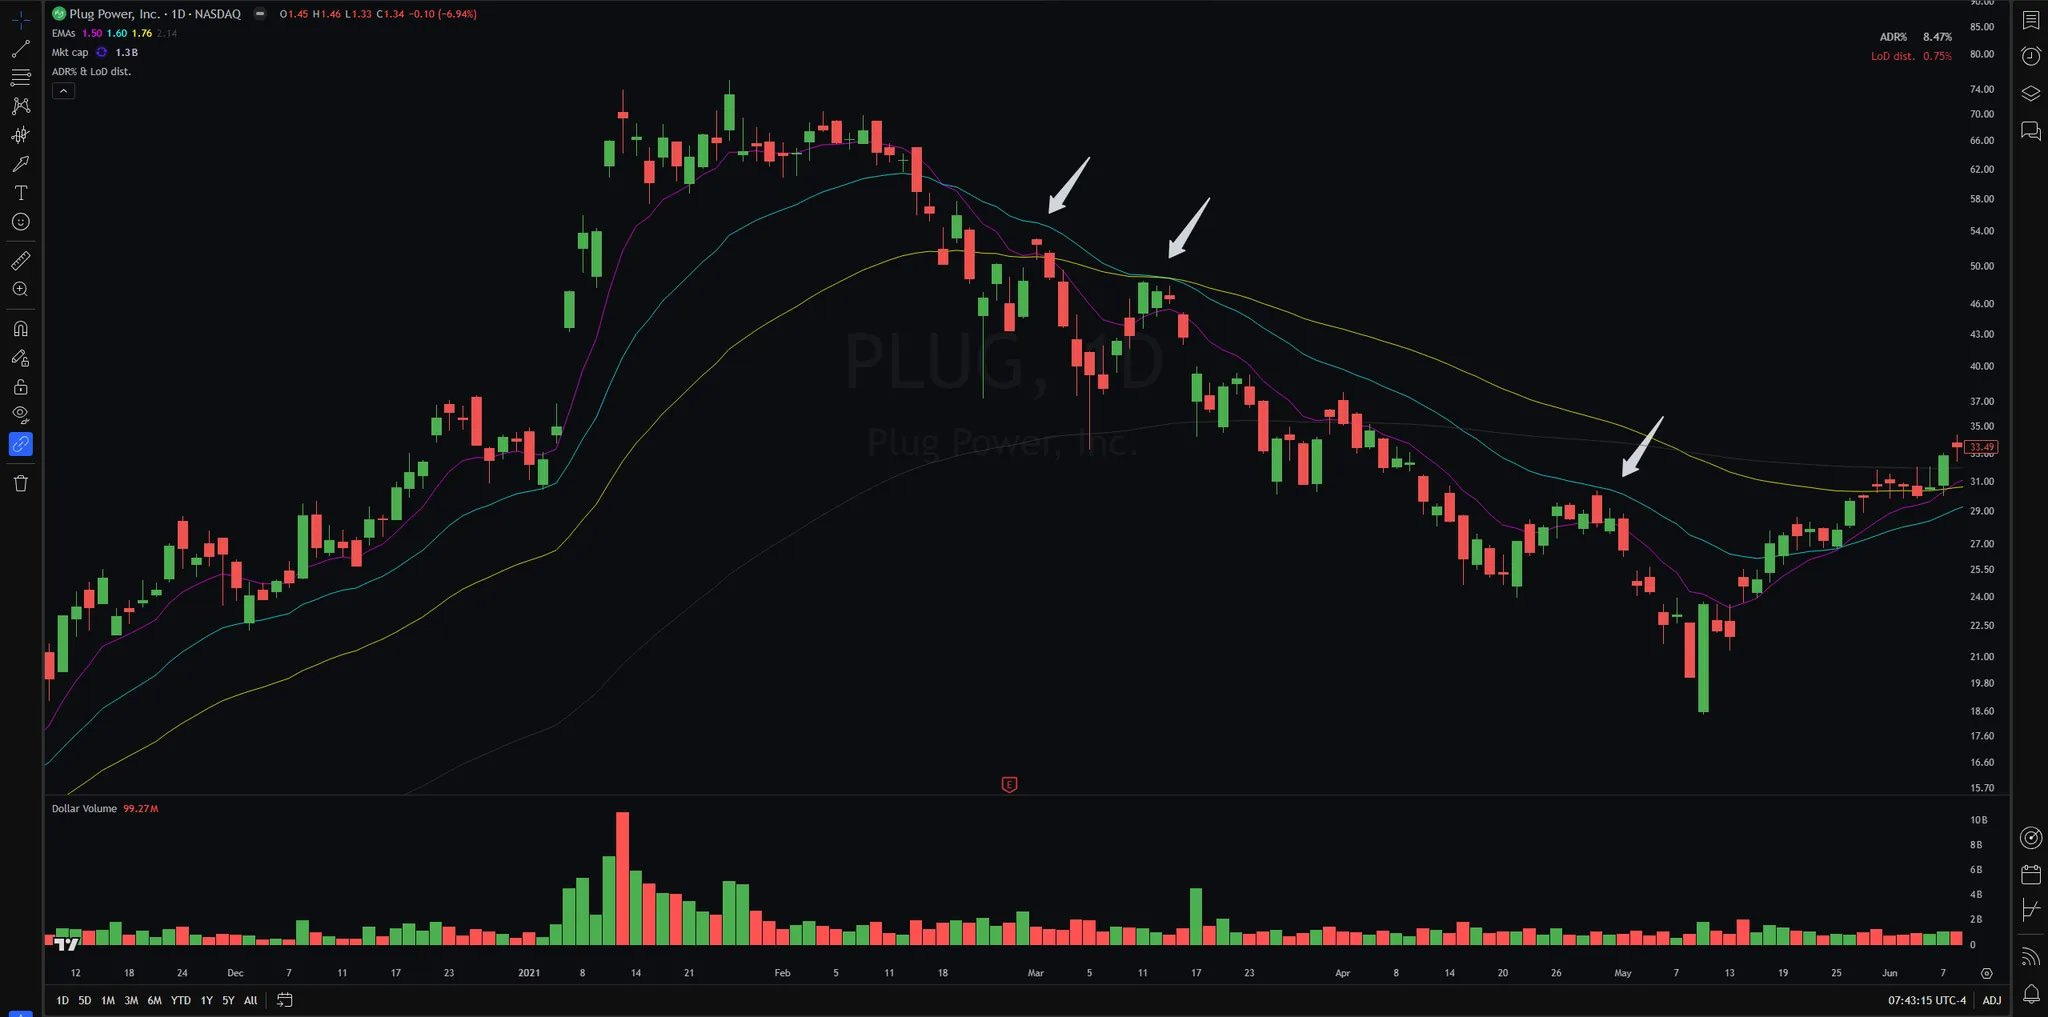
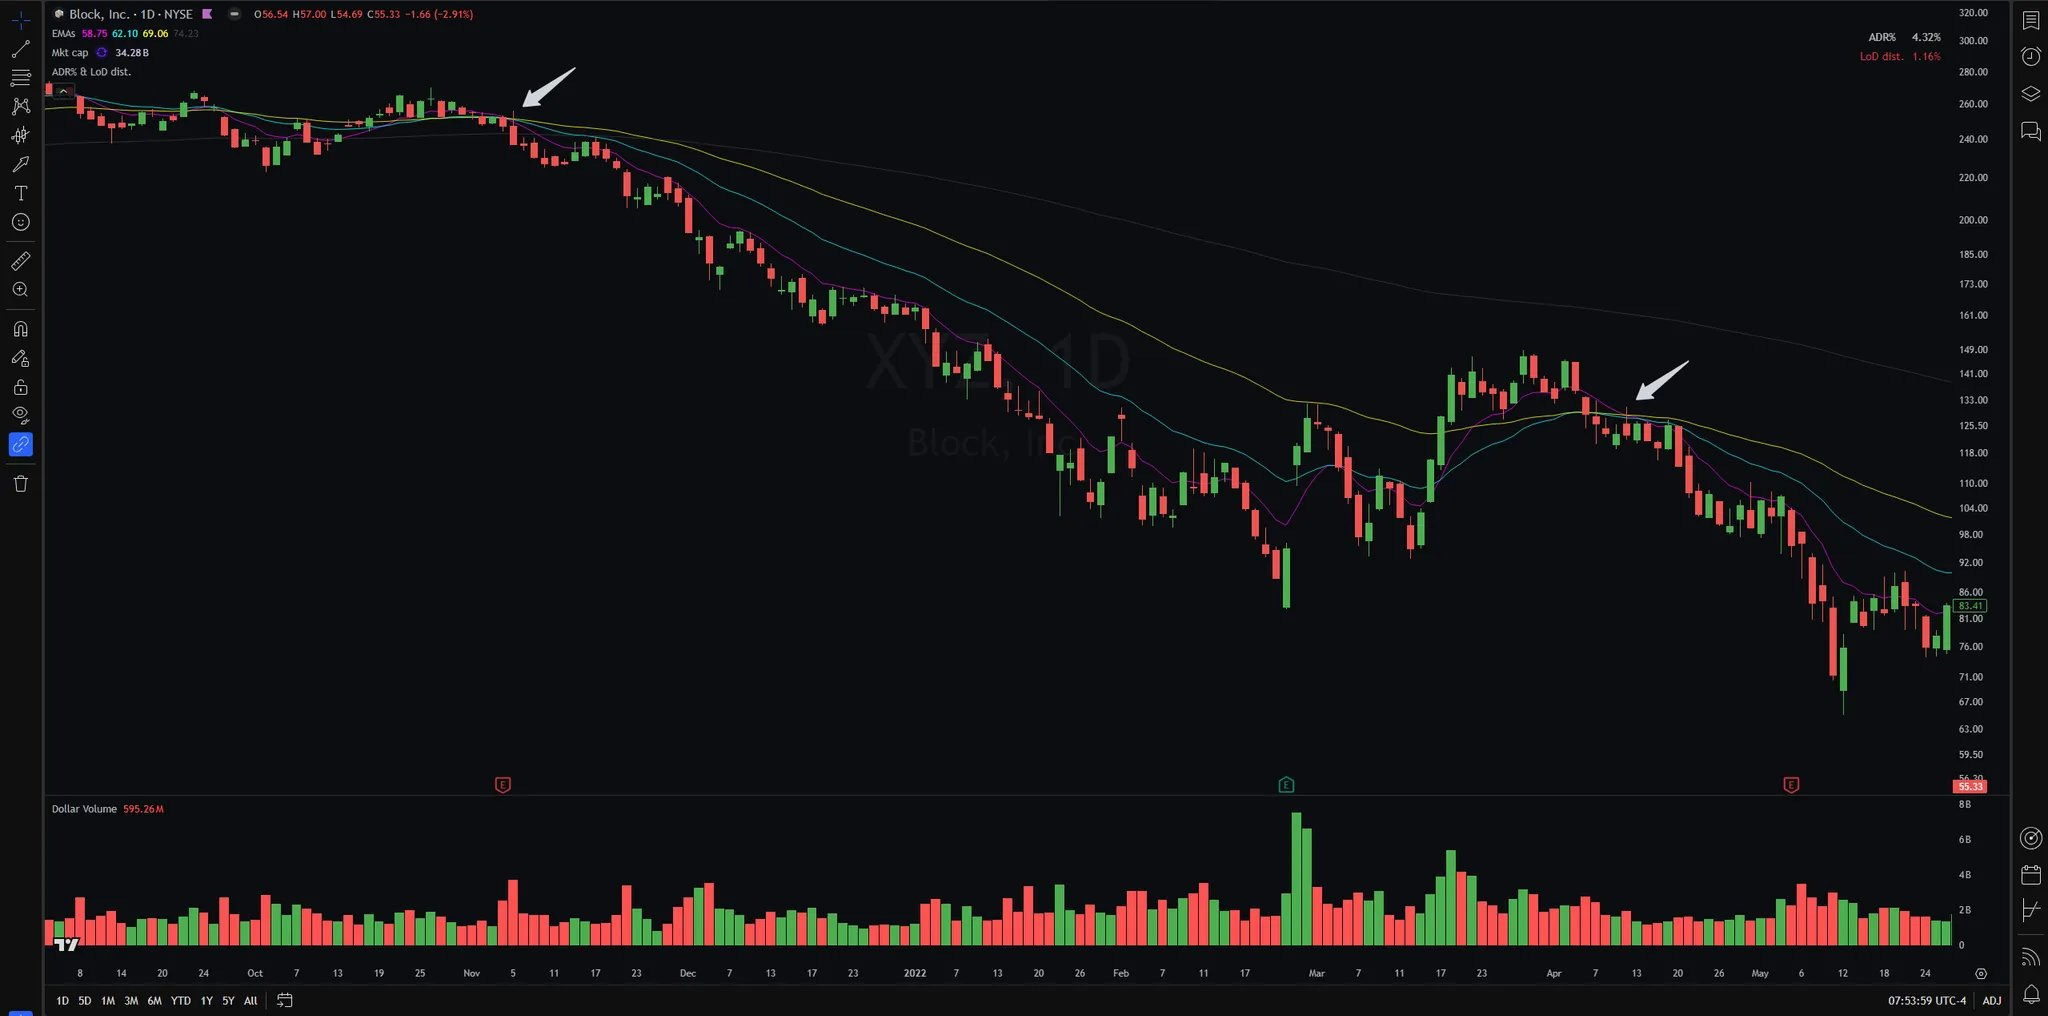
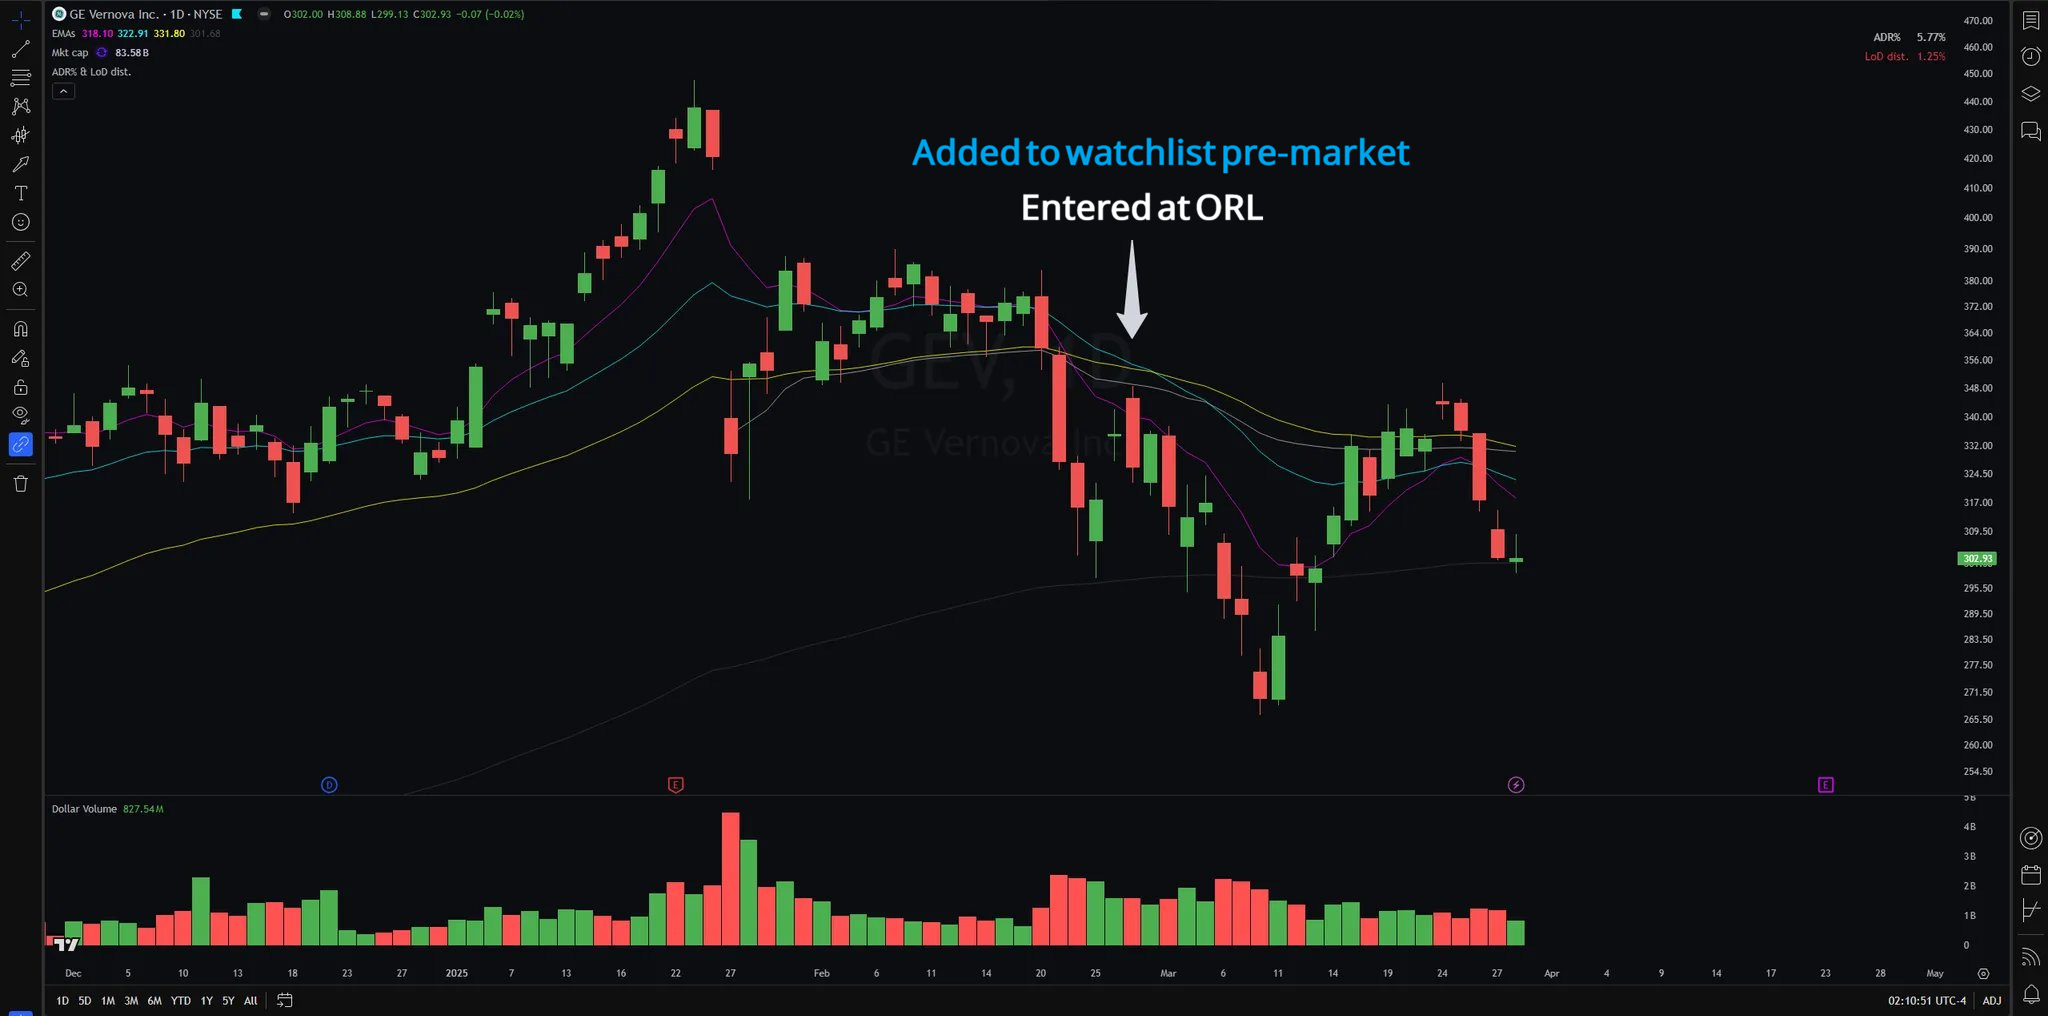
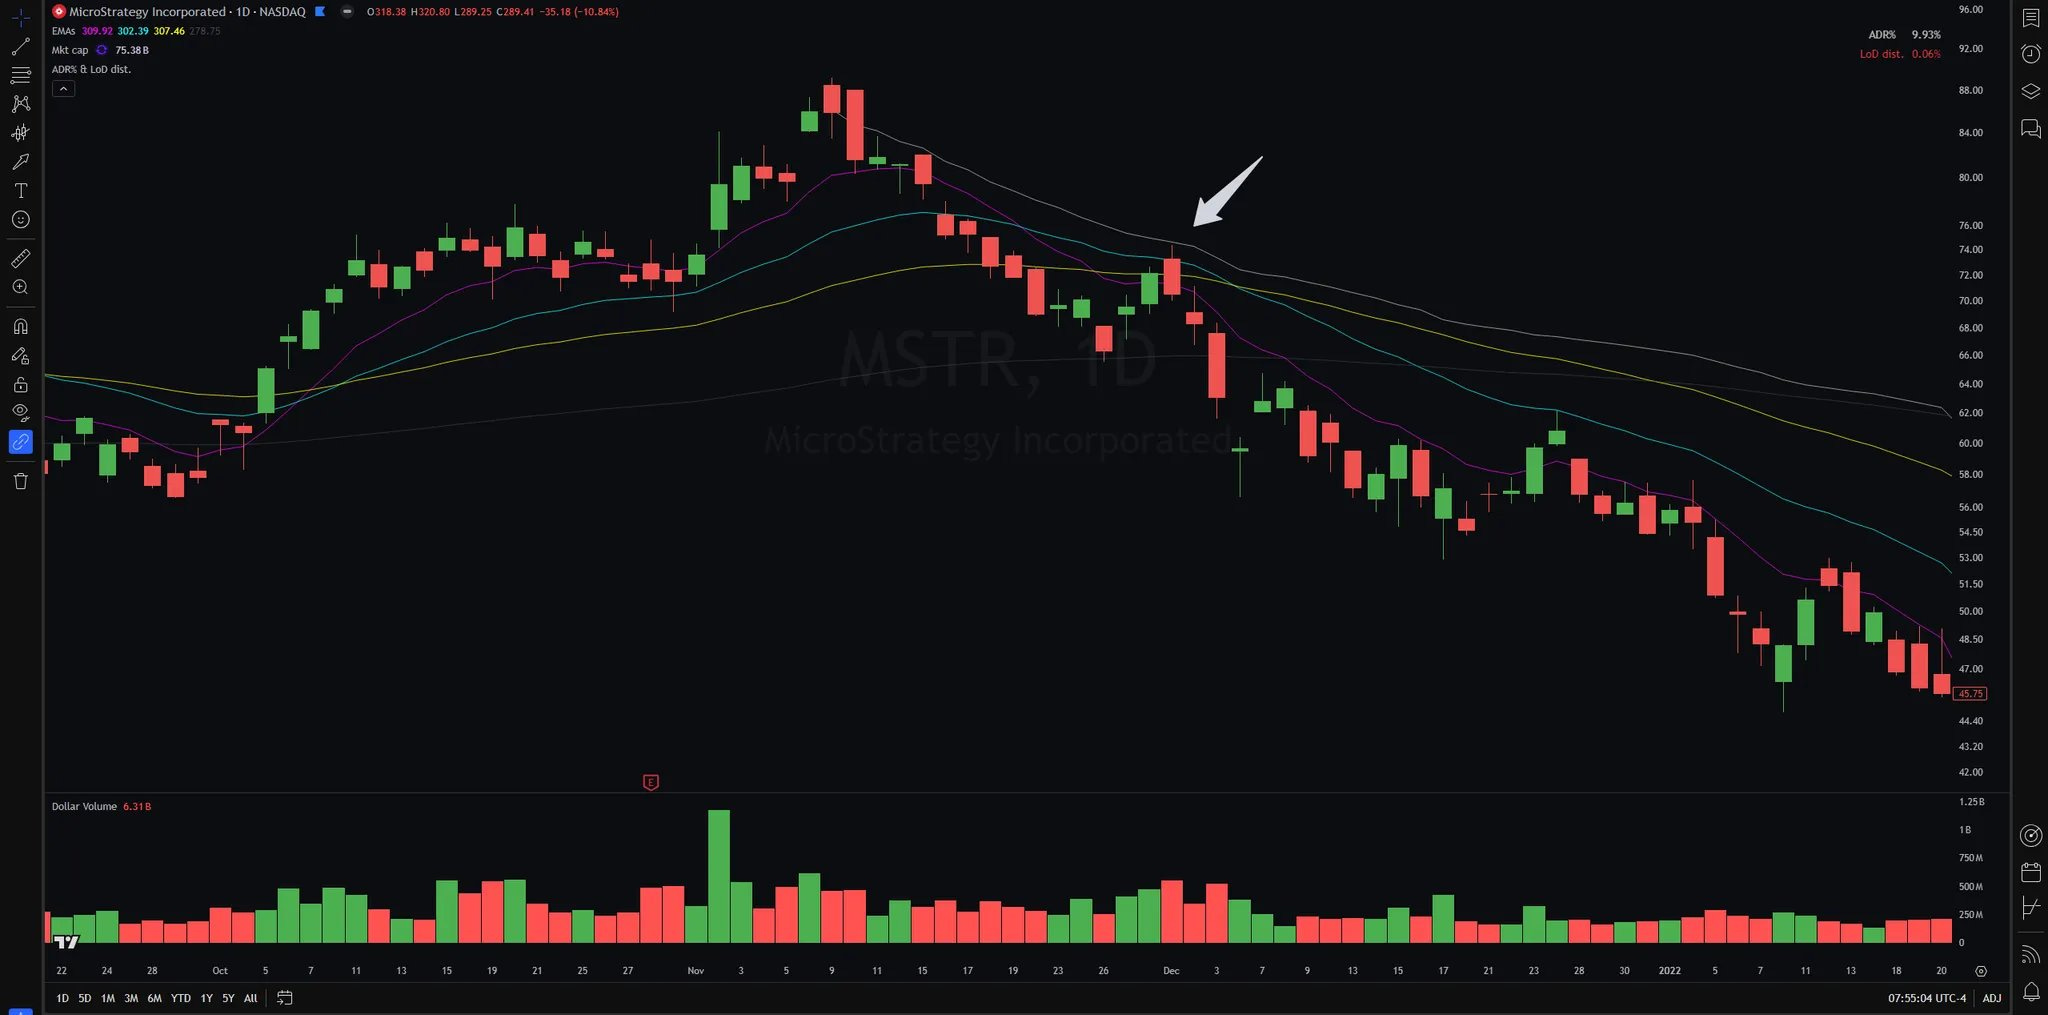
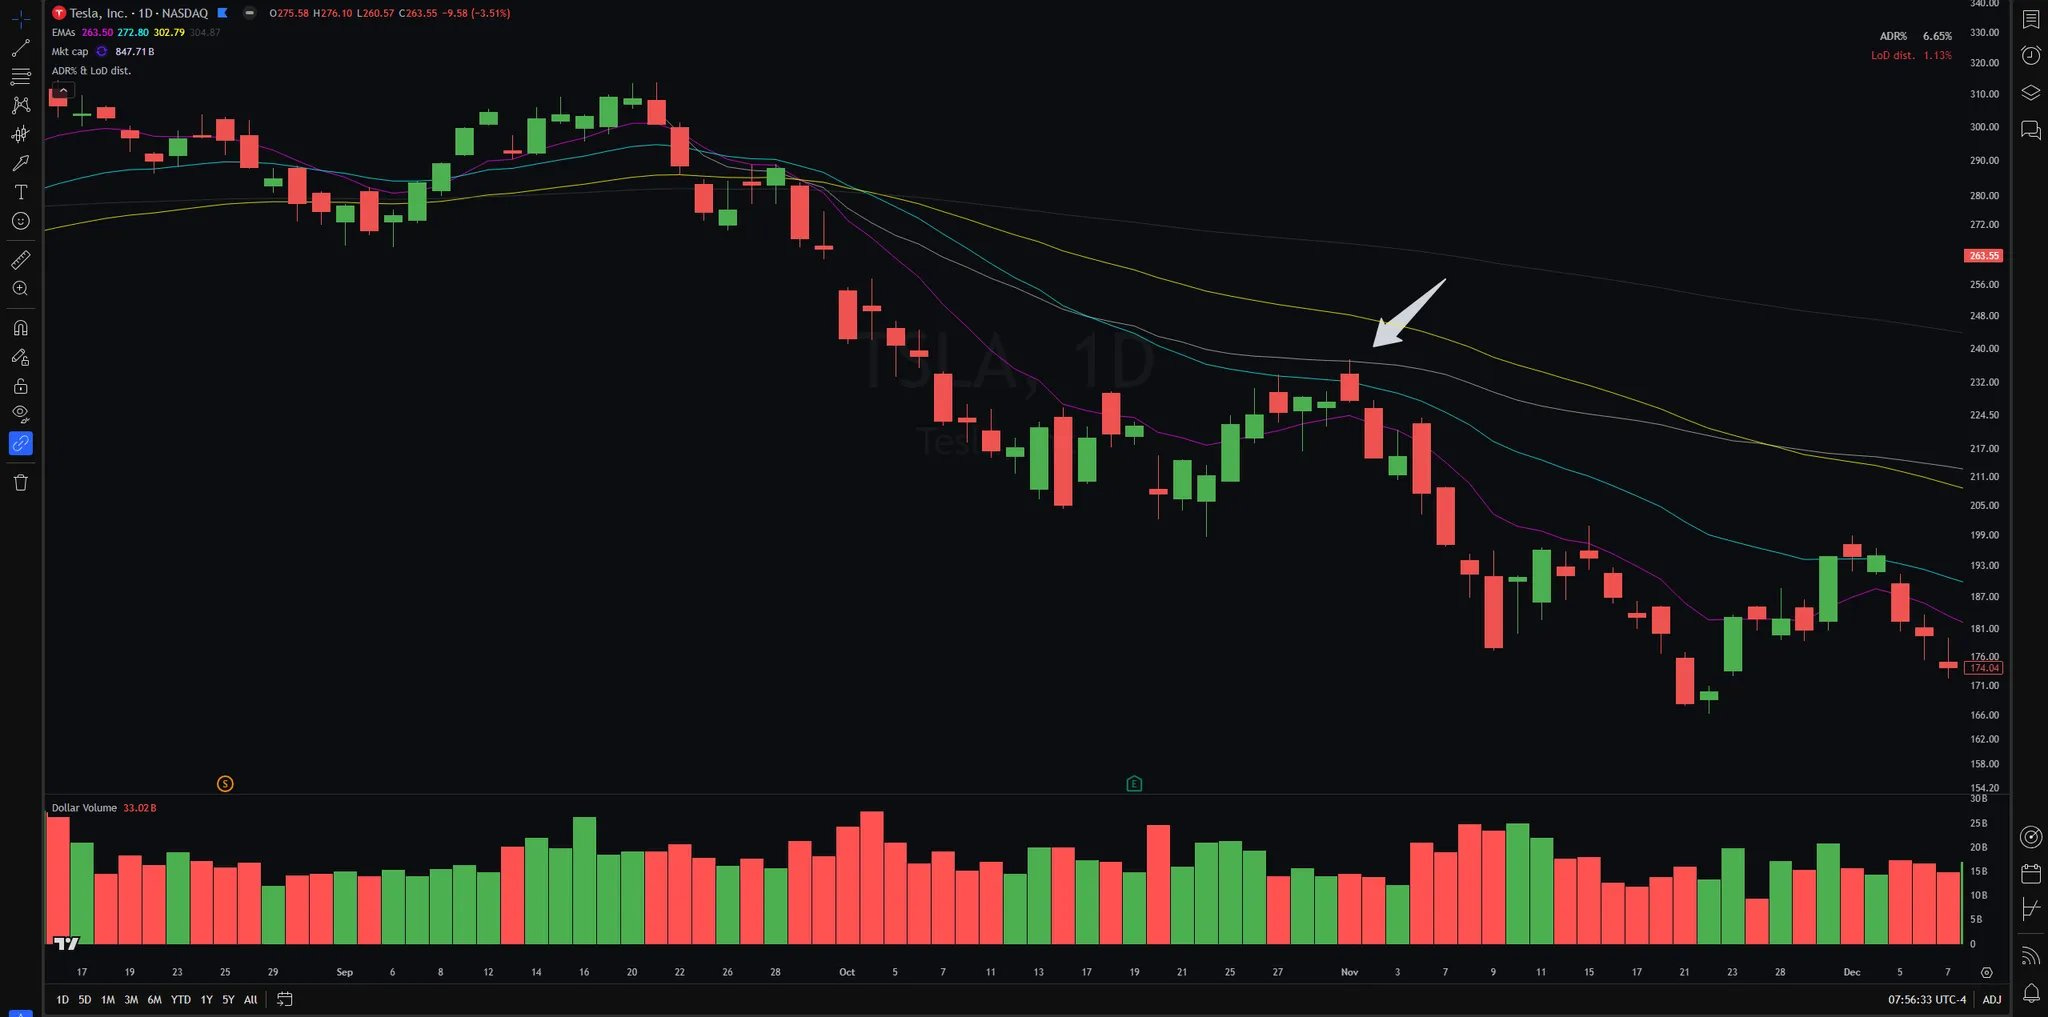
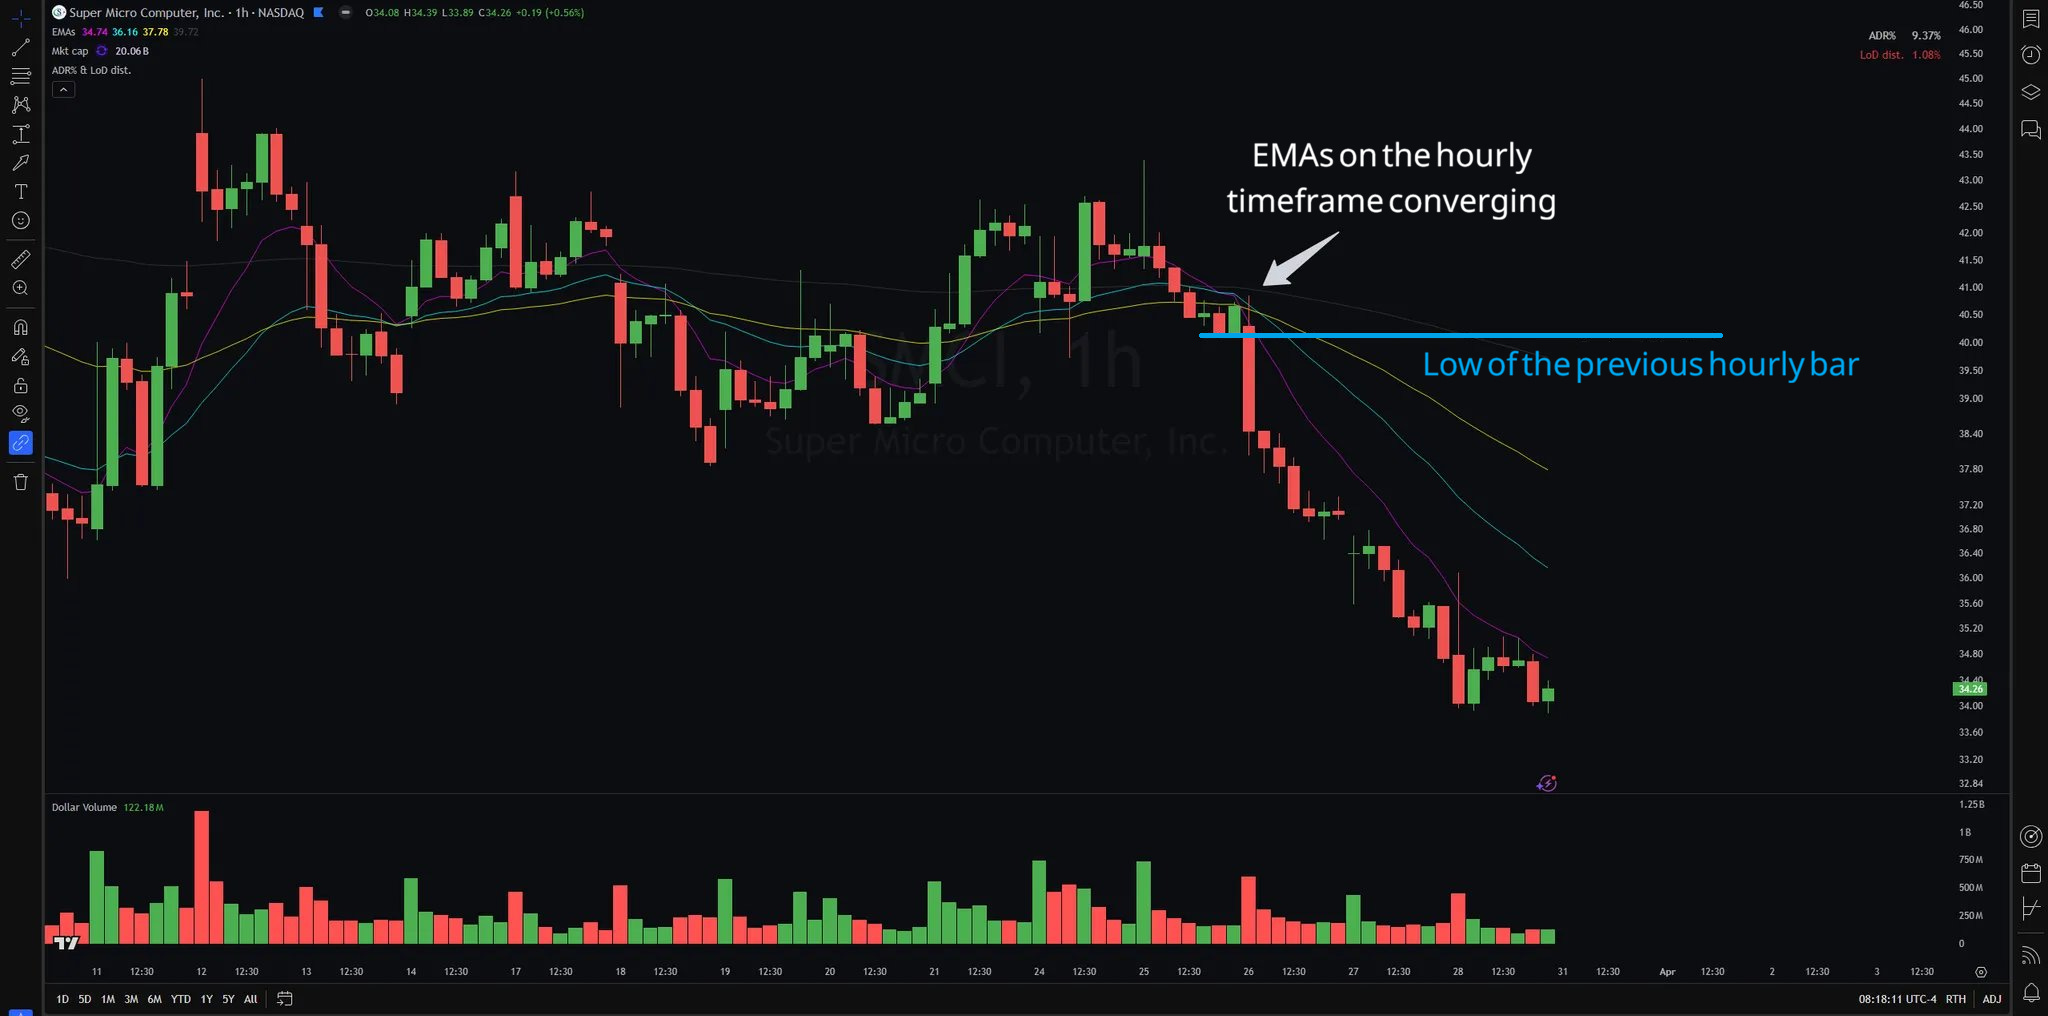
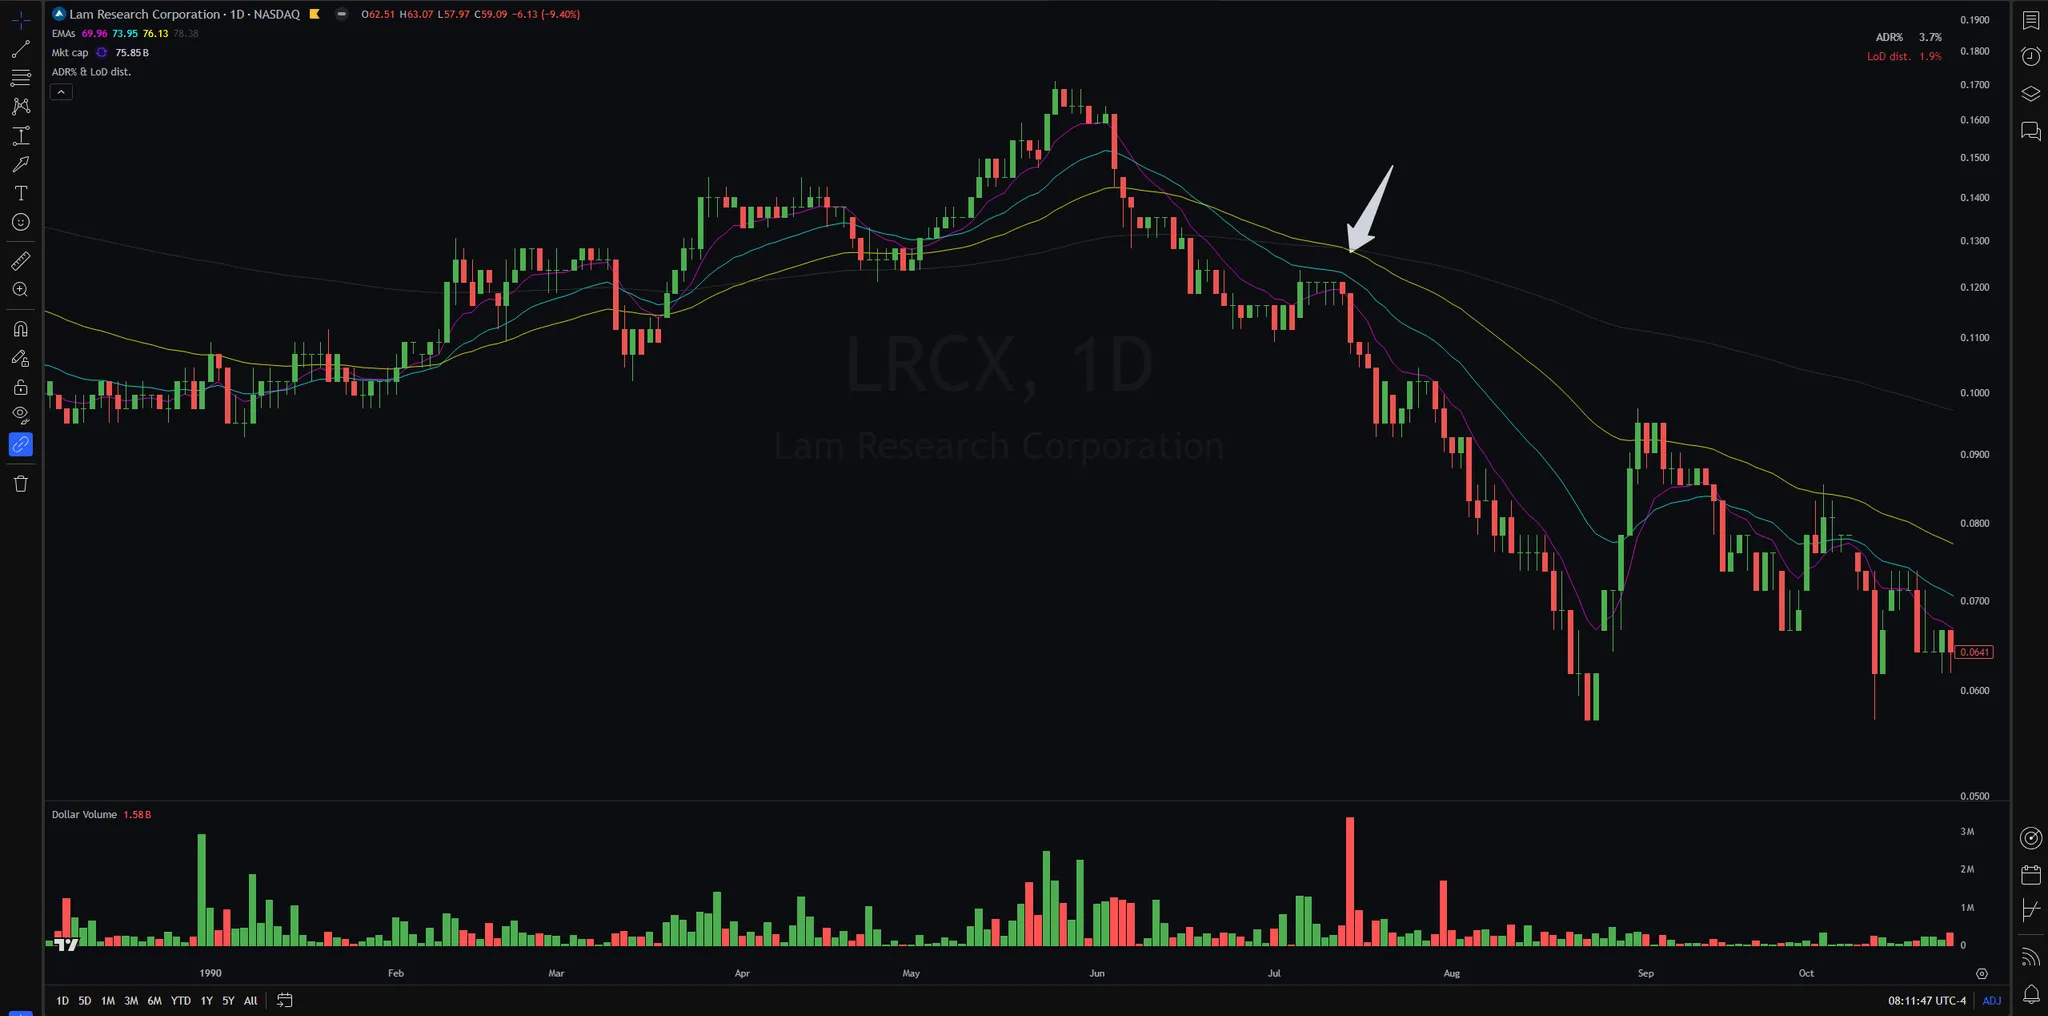
Stocks tend to decline immediately, without further basing, right after being rejected at the declining moving averages, particularly the 21 and 50 EMAs.
The tighter the EMAs, the higher the rejection rate.
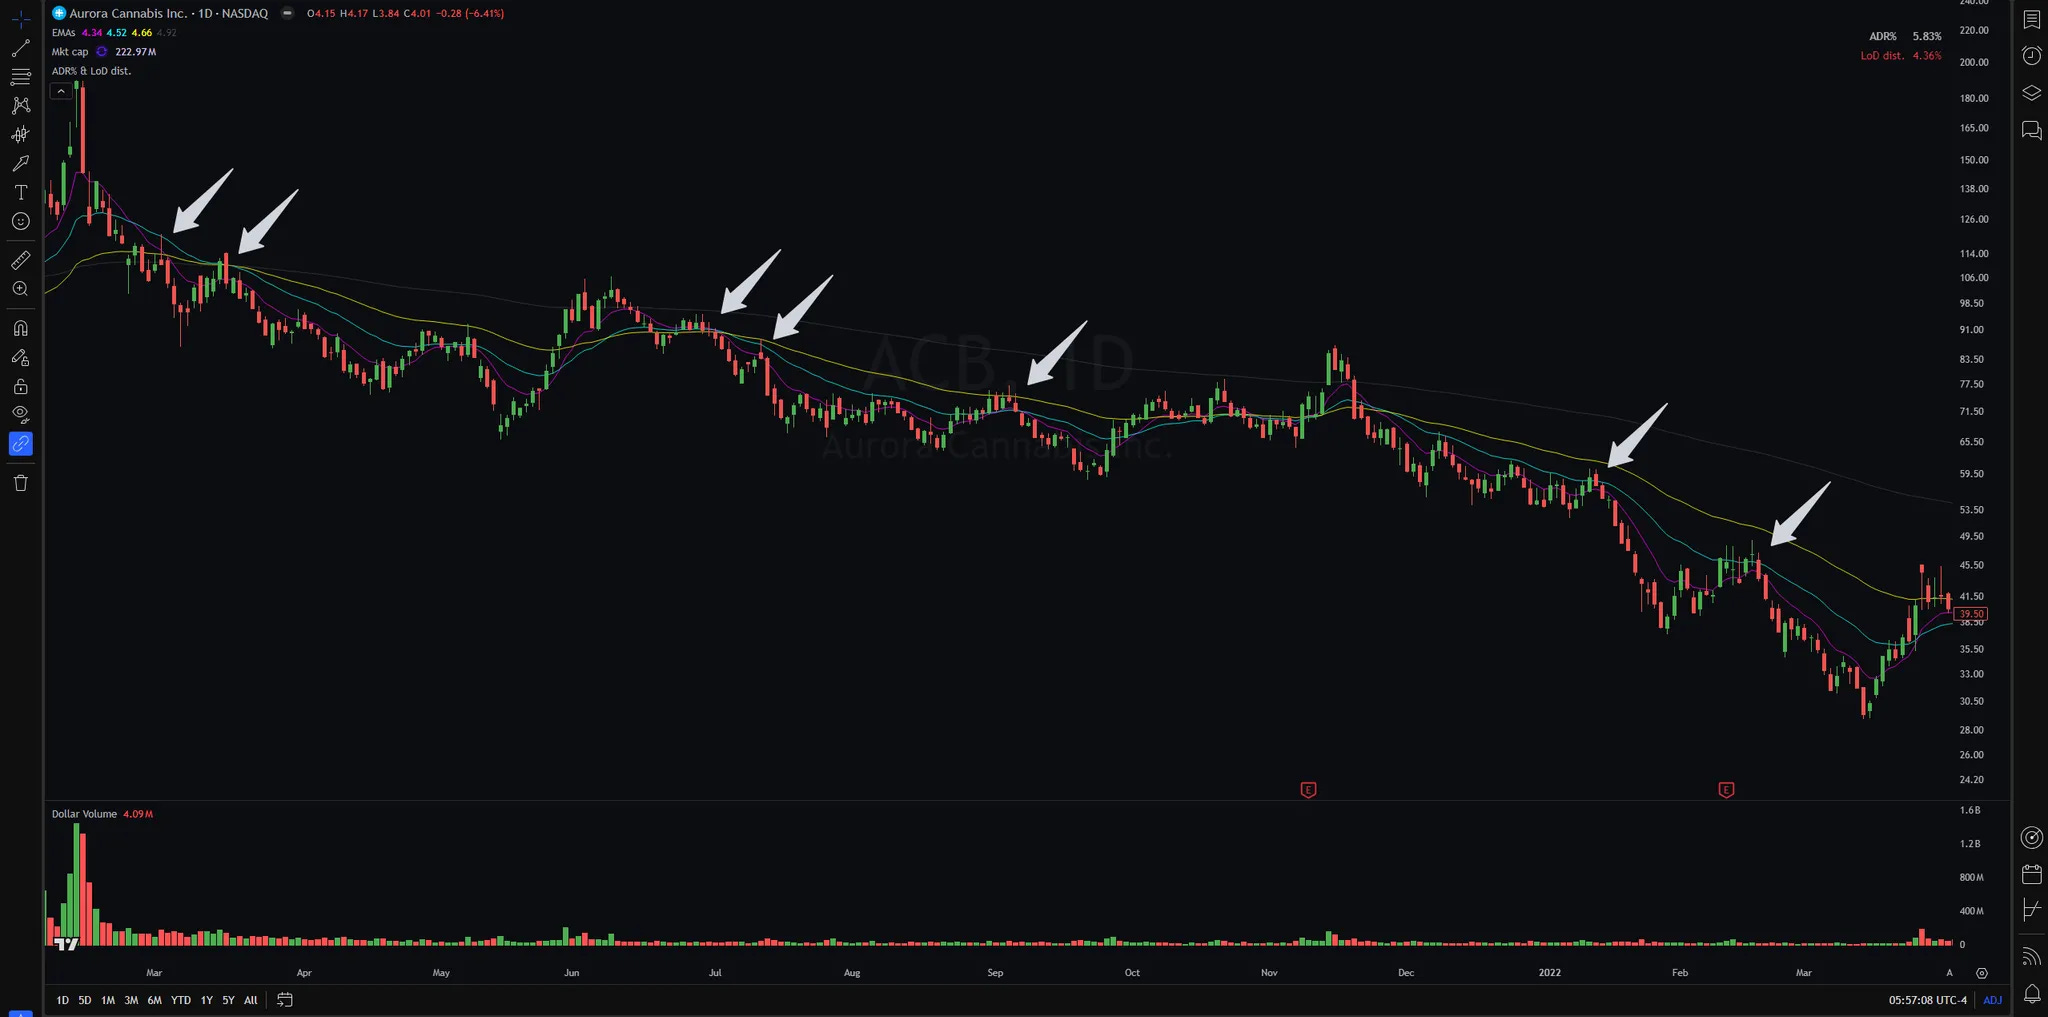
Then, I started looking at older charts:
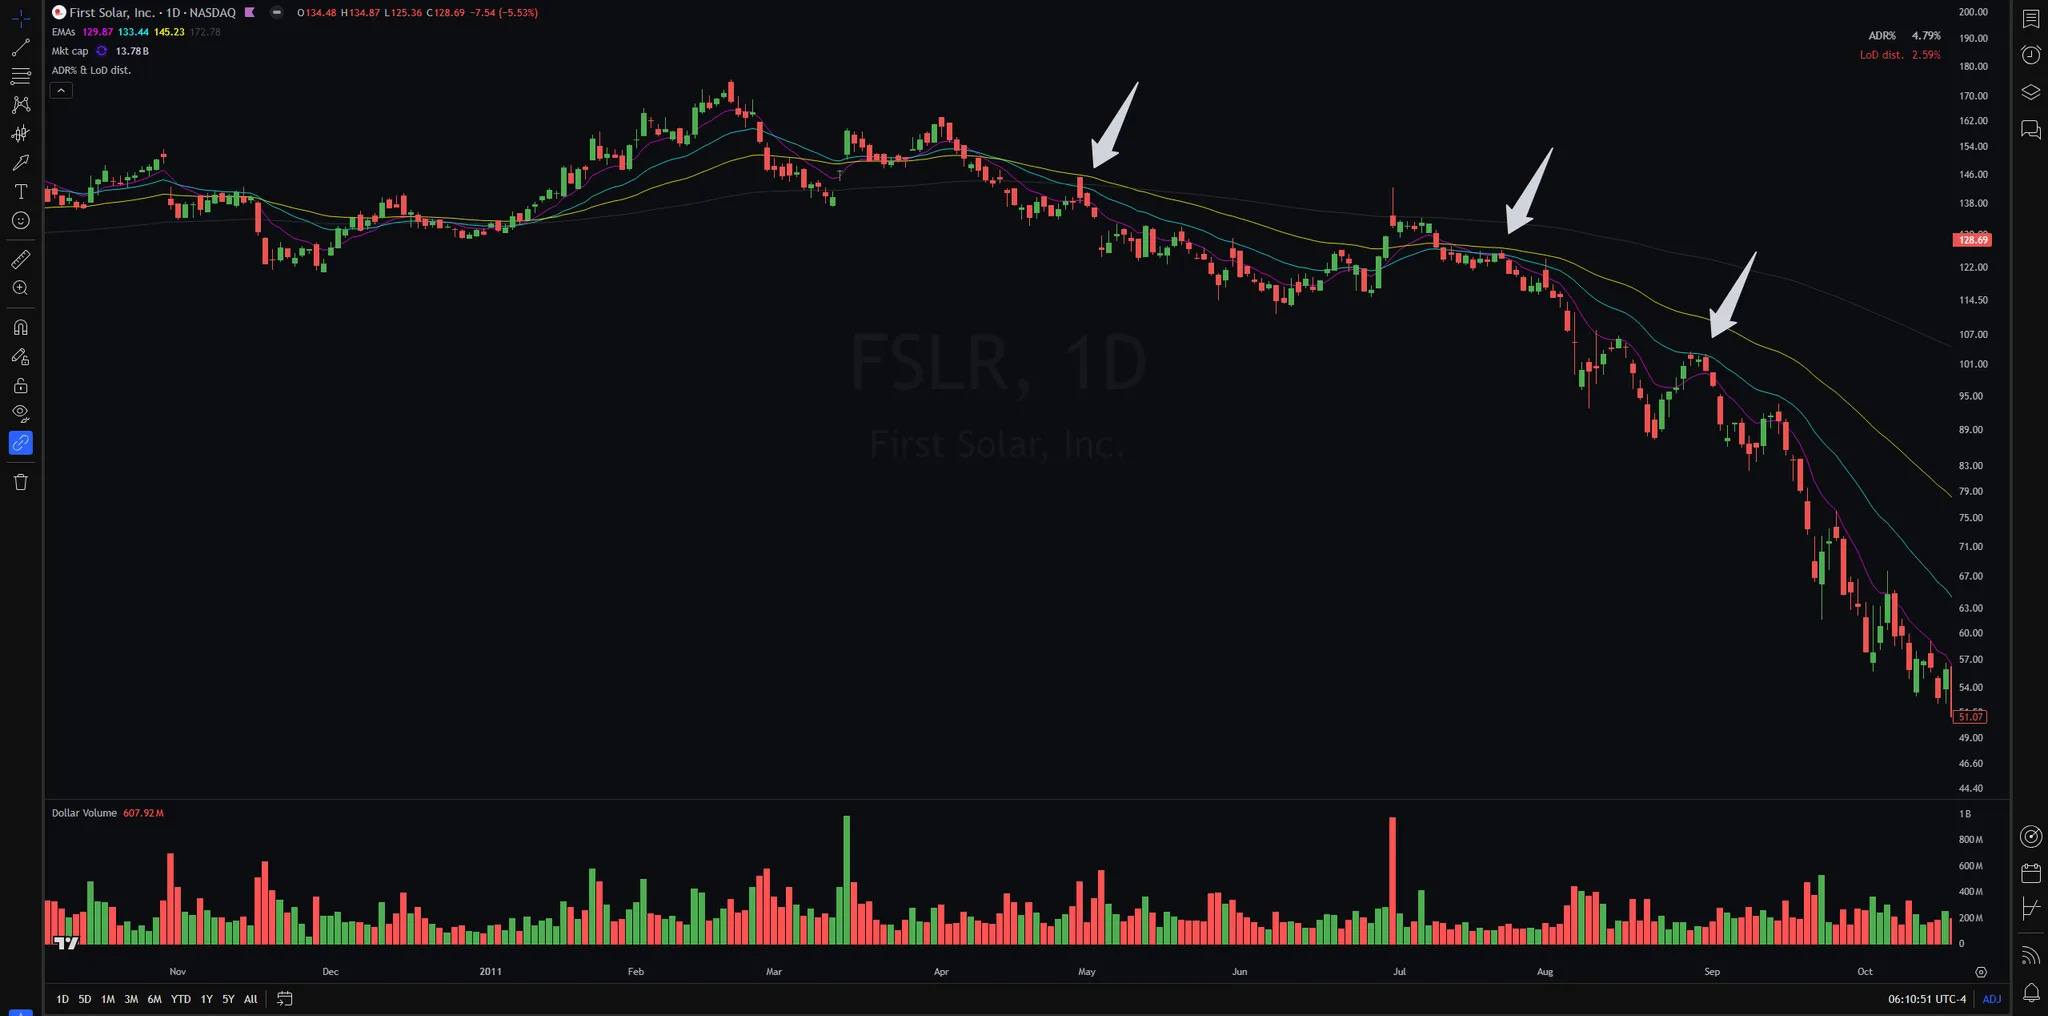
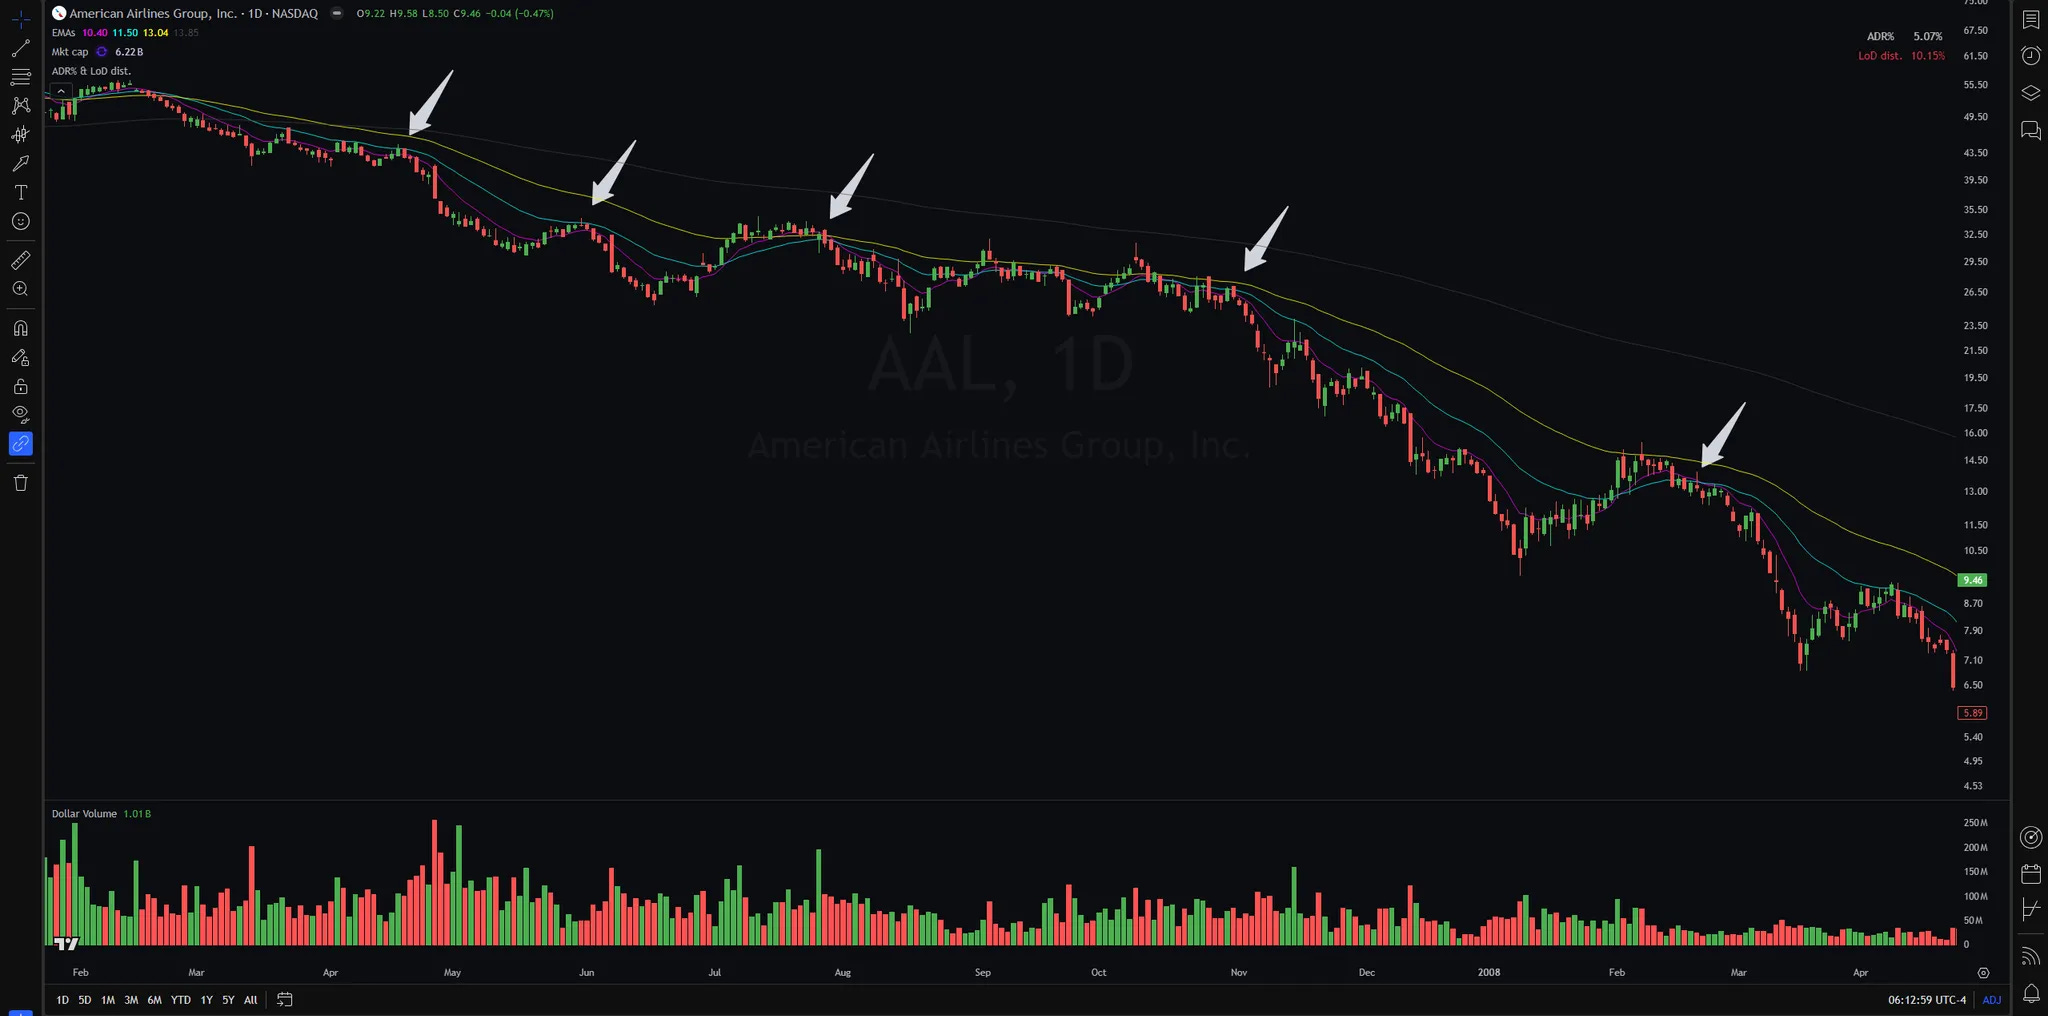
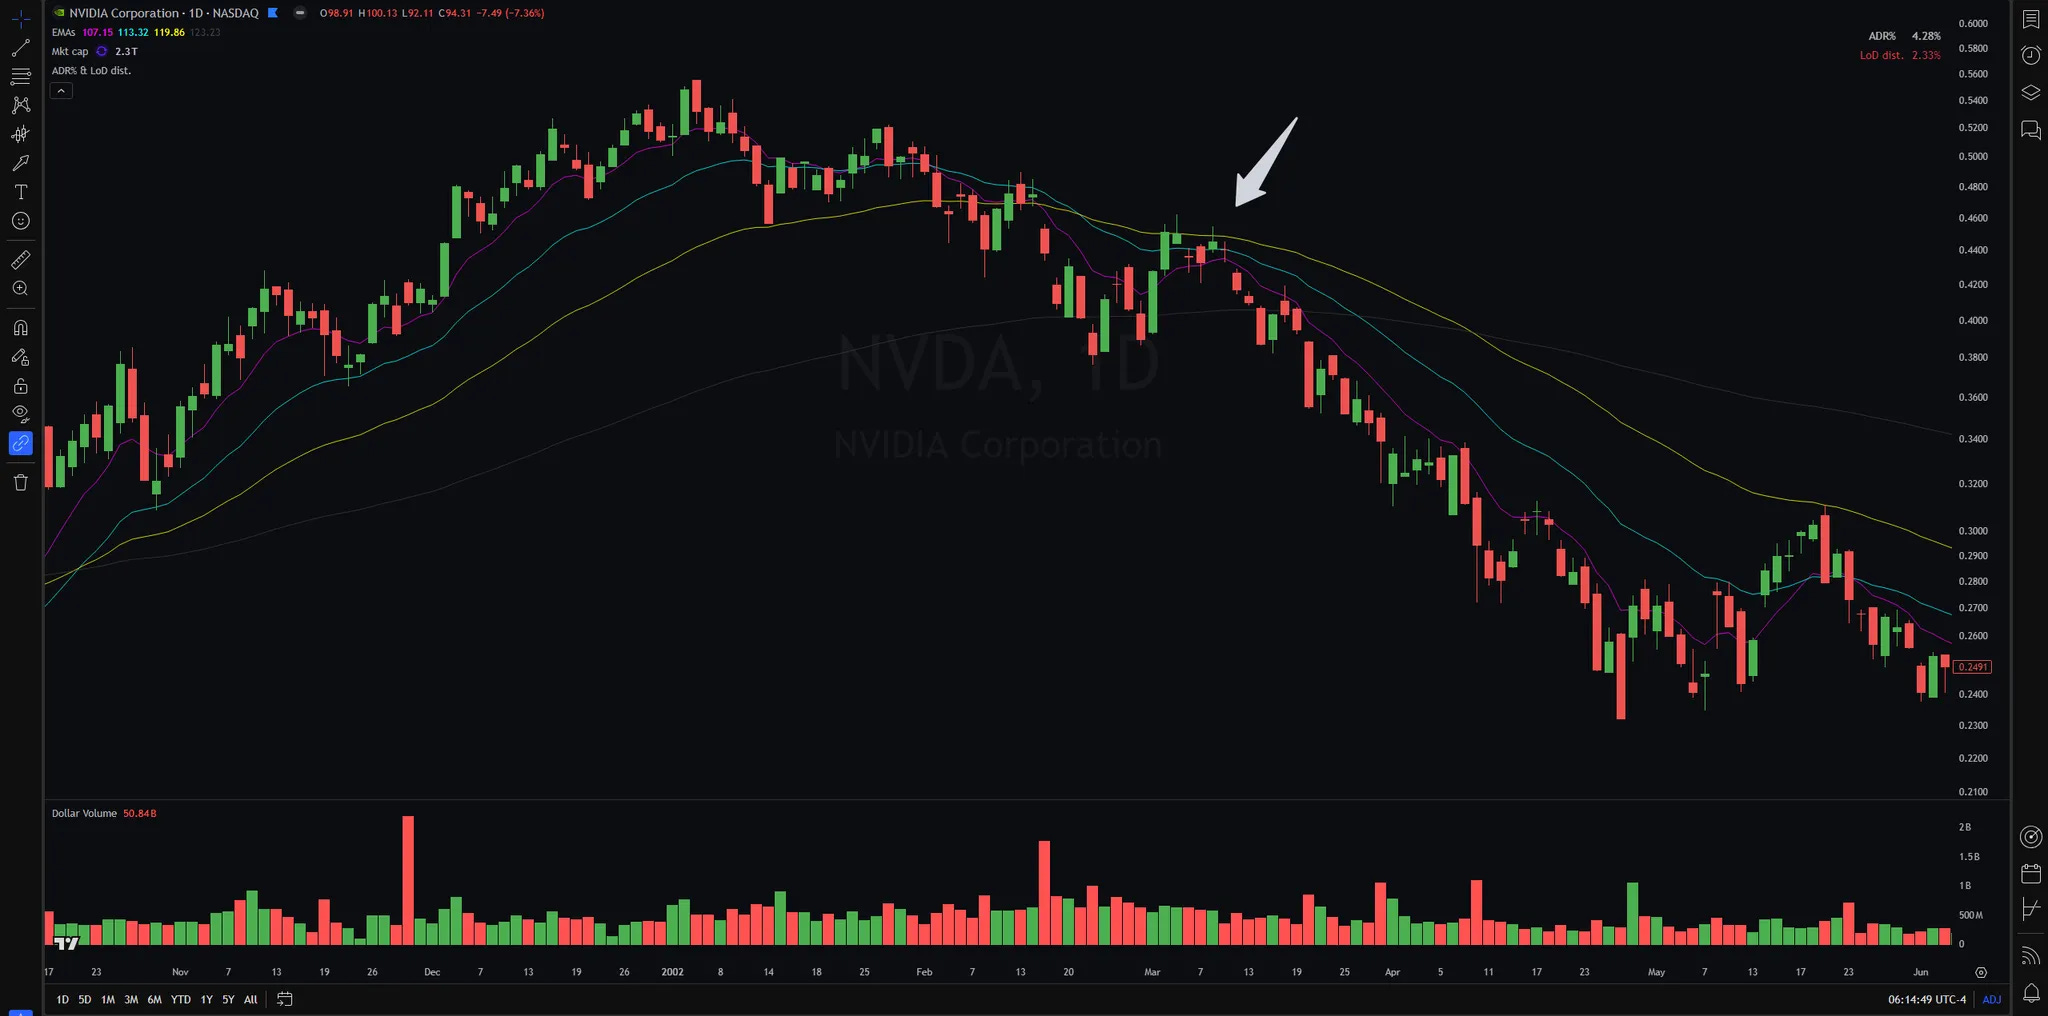
The more charts I studied, the more examples I found of this pattern.
I knew I was onto something.
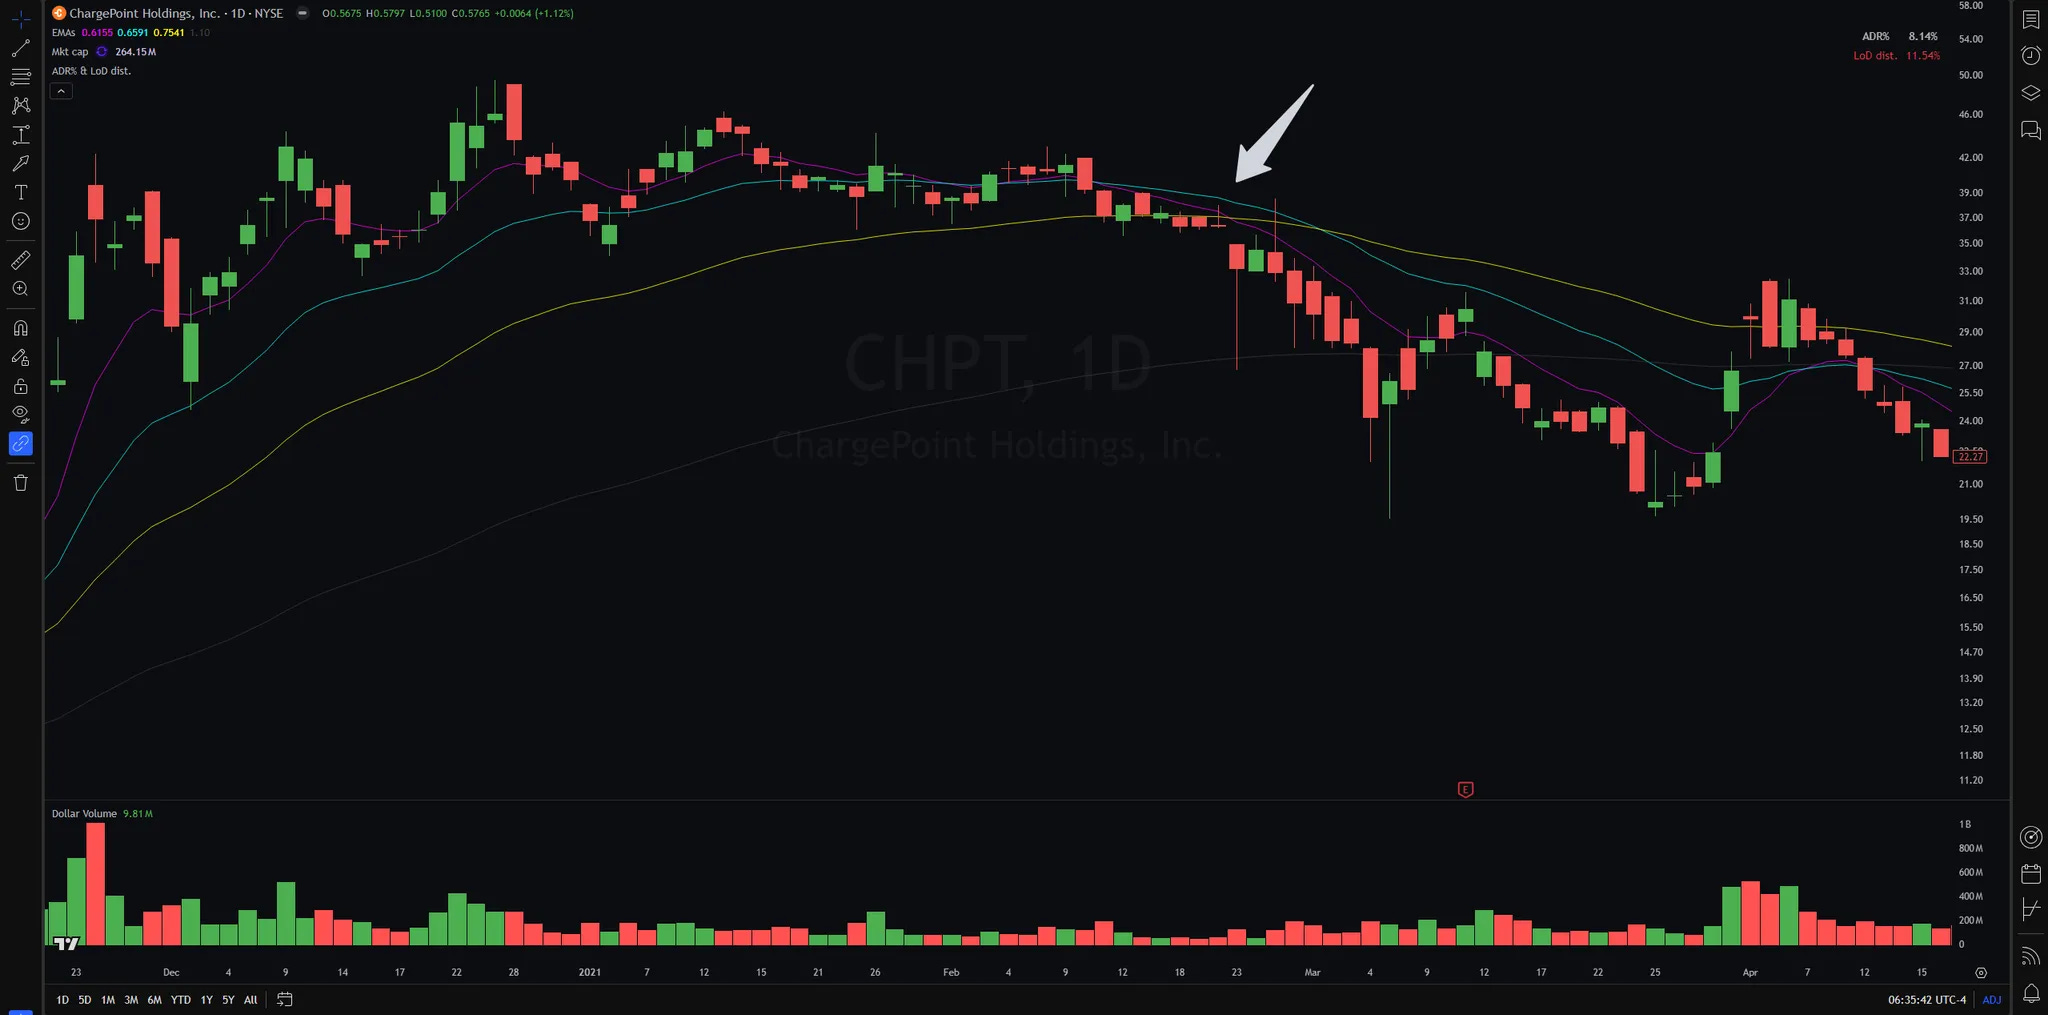
That was also when another question popped into my mind. Since I usually trade breakouts, often using the ORH or prior day high as my entry…
…would the ORL or prior day low work when trading reversals?
I couldn’t go back two years on the 1- or 5-minute timeframe. But when examining the daily chart, the ORL entry only seemed to work when the stock gaps up and immediately reverses.
When I zoomed in and looked at the hourly chart, I could also see that using the prior day low wouldn’t work well either.
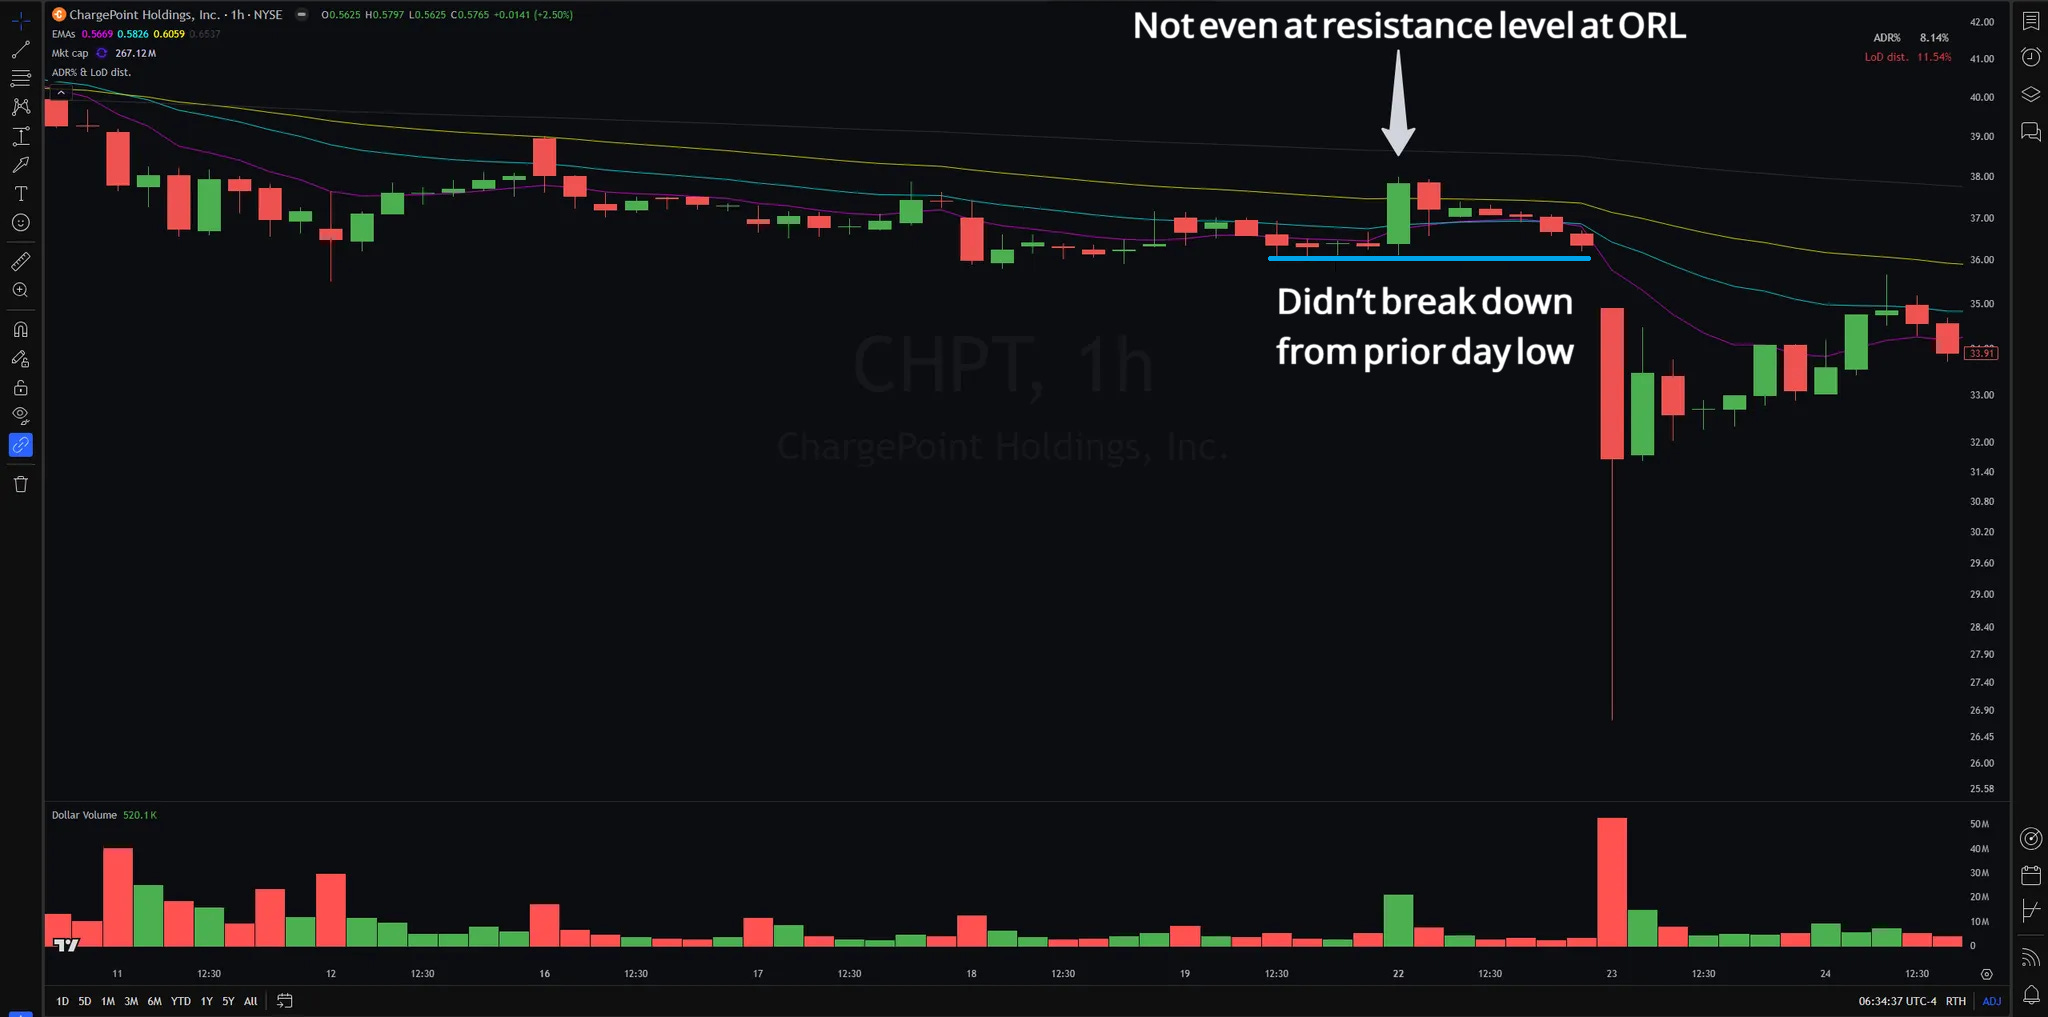
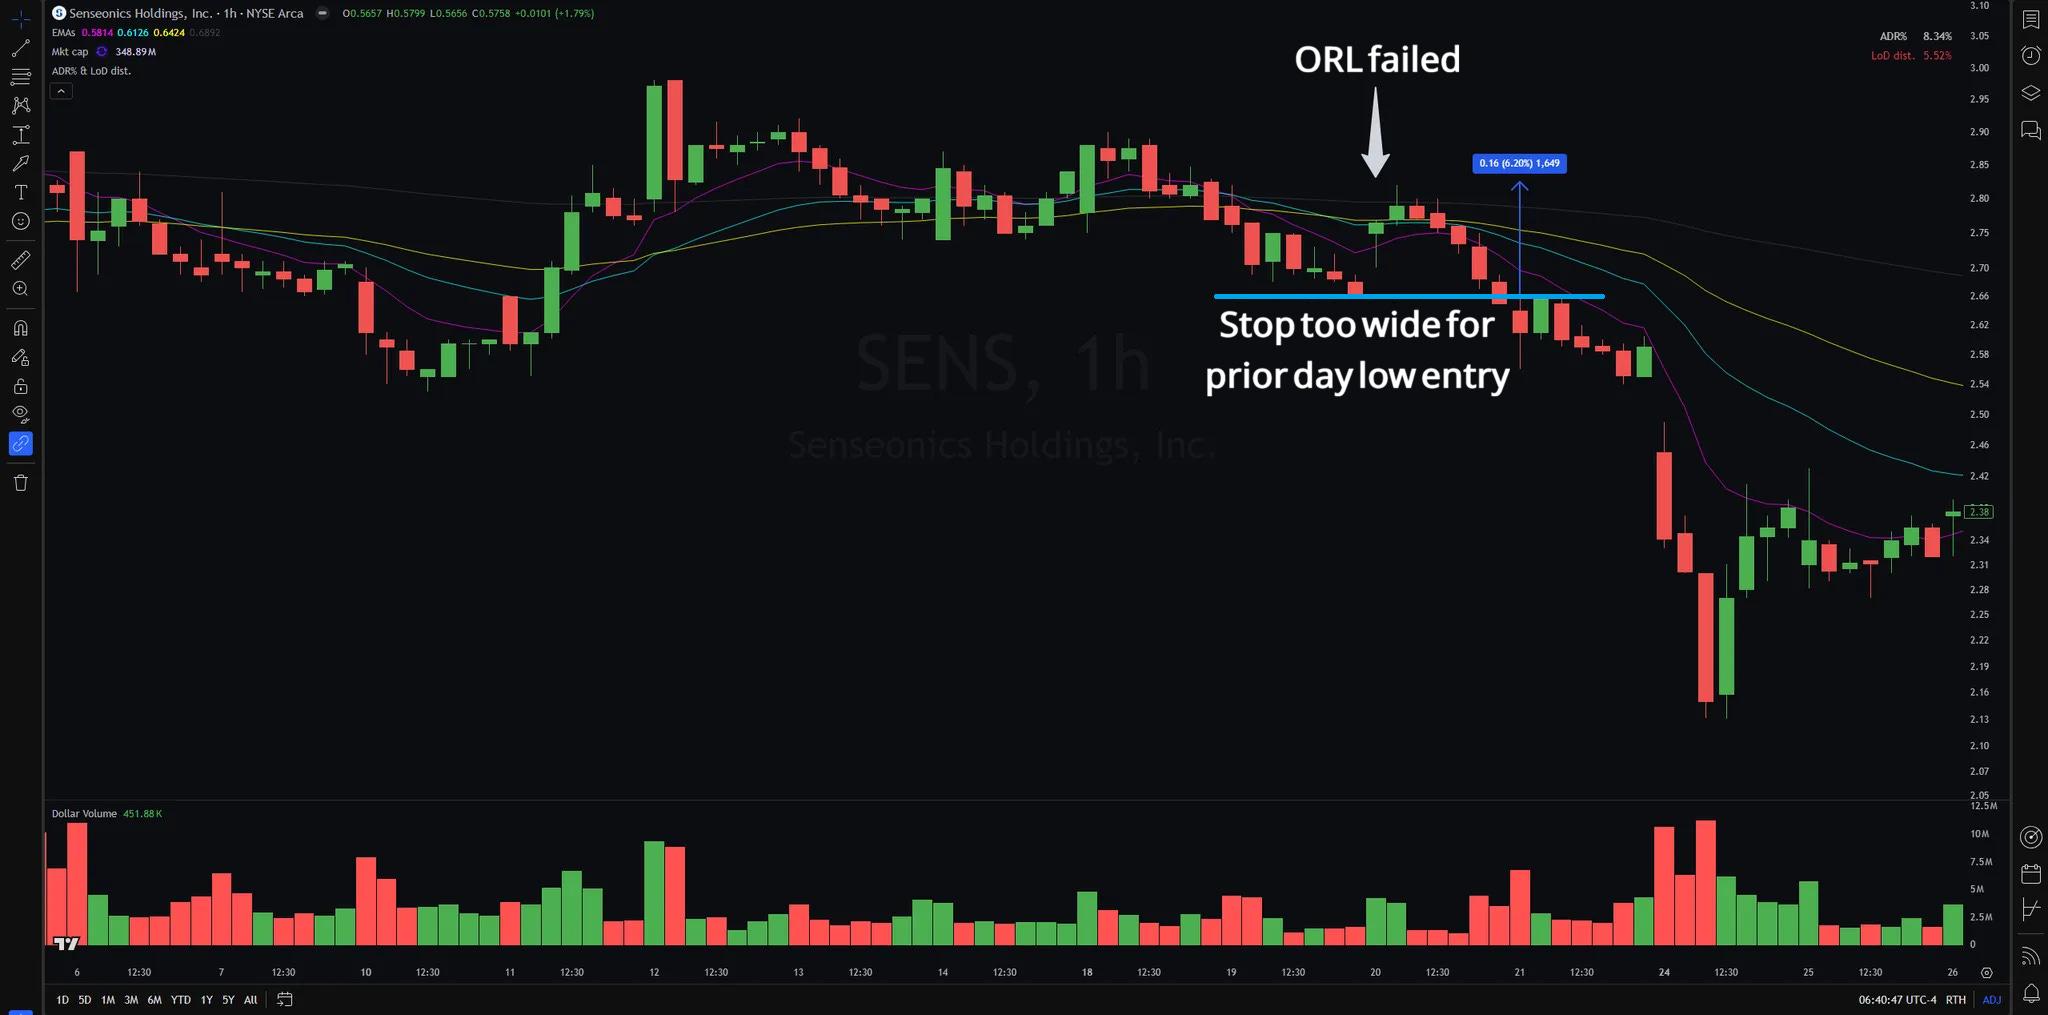
It’s easy to trade in hindsight, as you know which bar reverses and which one doesn’t. Many stocks also overshoot resistance before falling apart.
So, if my entry tactic idea wouldn’t work even with the benefit of hindsight, I needed to find a better entry point.
I flipped through more charts, focusing on the stocks that wouldn’t have worked with a prior day low or ORL entry, asking the question:
How can I manage risk for a reversal?
I failed to come up with the answer until I revisited Brian Shannon’s presentation at the 2021 TraderLion Trading Conference:
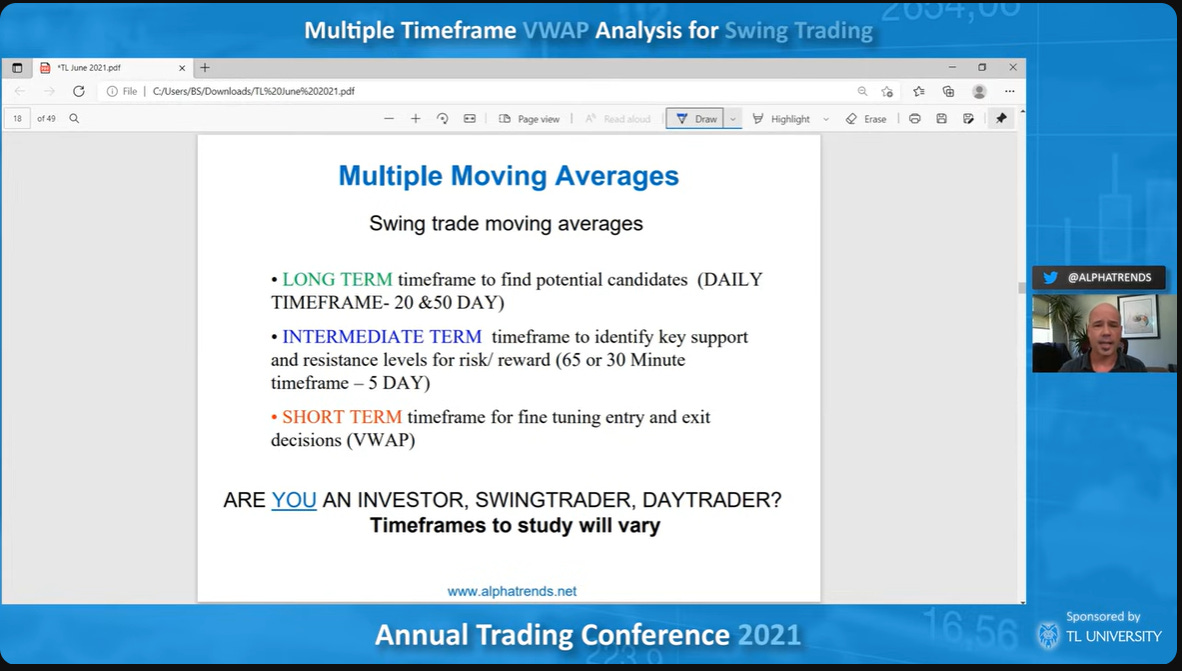
Every trend on a longer timeframe begins with a trend on a shorter timeframe, in both directions.
That means every reversal on a longer timeframe originates from a breakdown on a shorter timeframe.
I then also recalled Qullamaggie mentioning the intraday rejection of VWAP when he explained how to trade the parabolic short setup on his blog:
“When you think you have identified a candidate, you can short on the opening range lows (1-minute, 5-minute candles). You can wait for the first red 5-minute candle in case the stock goes straight up from the open.
“You can wait for the stock to have the first crack, bounce back into VWAP (the only intraday indicator I really use) and if it fails at VWAP you can enter (or add). The fail could be the first red 1- or 5-minute candle into the VWAP.
“The stop is highs of the day or, with a VWAP fail, a reclaim of the VWAP. The key is to get relatively tight and defined stops.”
Kyna: I lightly copy-edited Kristjan’s quote for clarity.That’s when the concepts came together and connected.
You gain an edge when multiple timeframes echo each other.
After determining potential resistance in a higher timeframe, the lower timeframe must confirm it.
Two potential resistance areas on the higher timeframe:
1. Declining moving averages near the tightening EMAs.
2. Declining AVWAPs near the tightening EMAs.
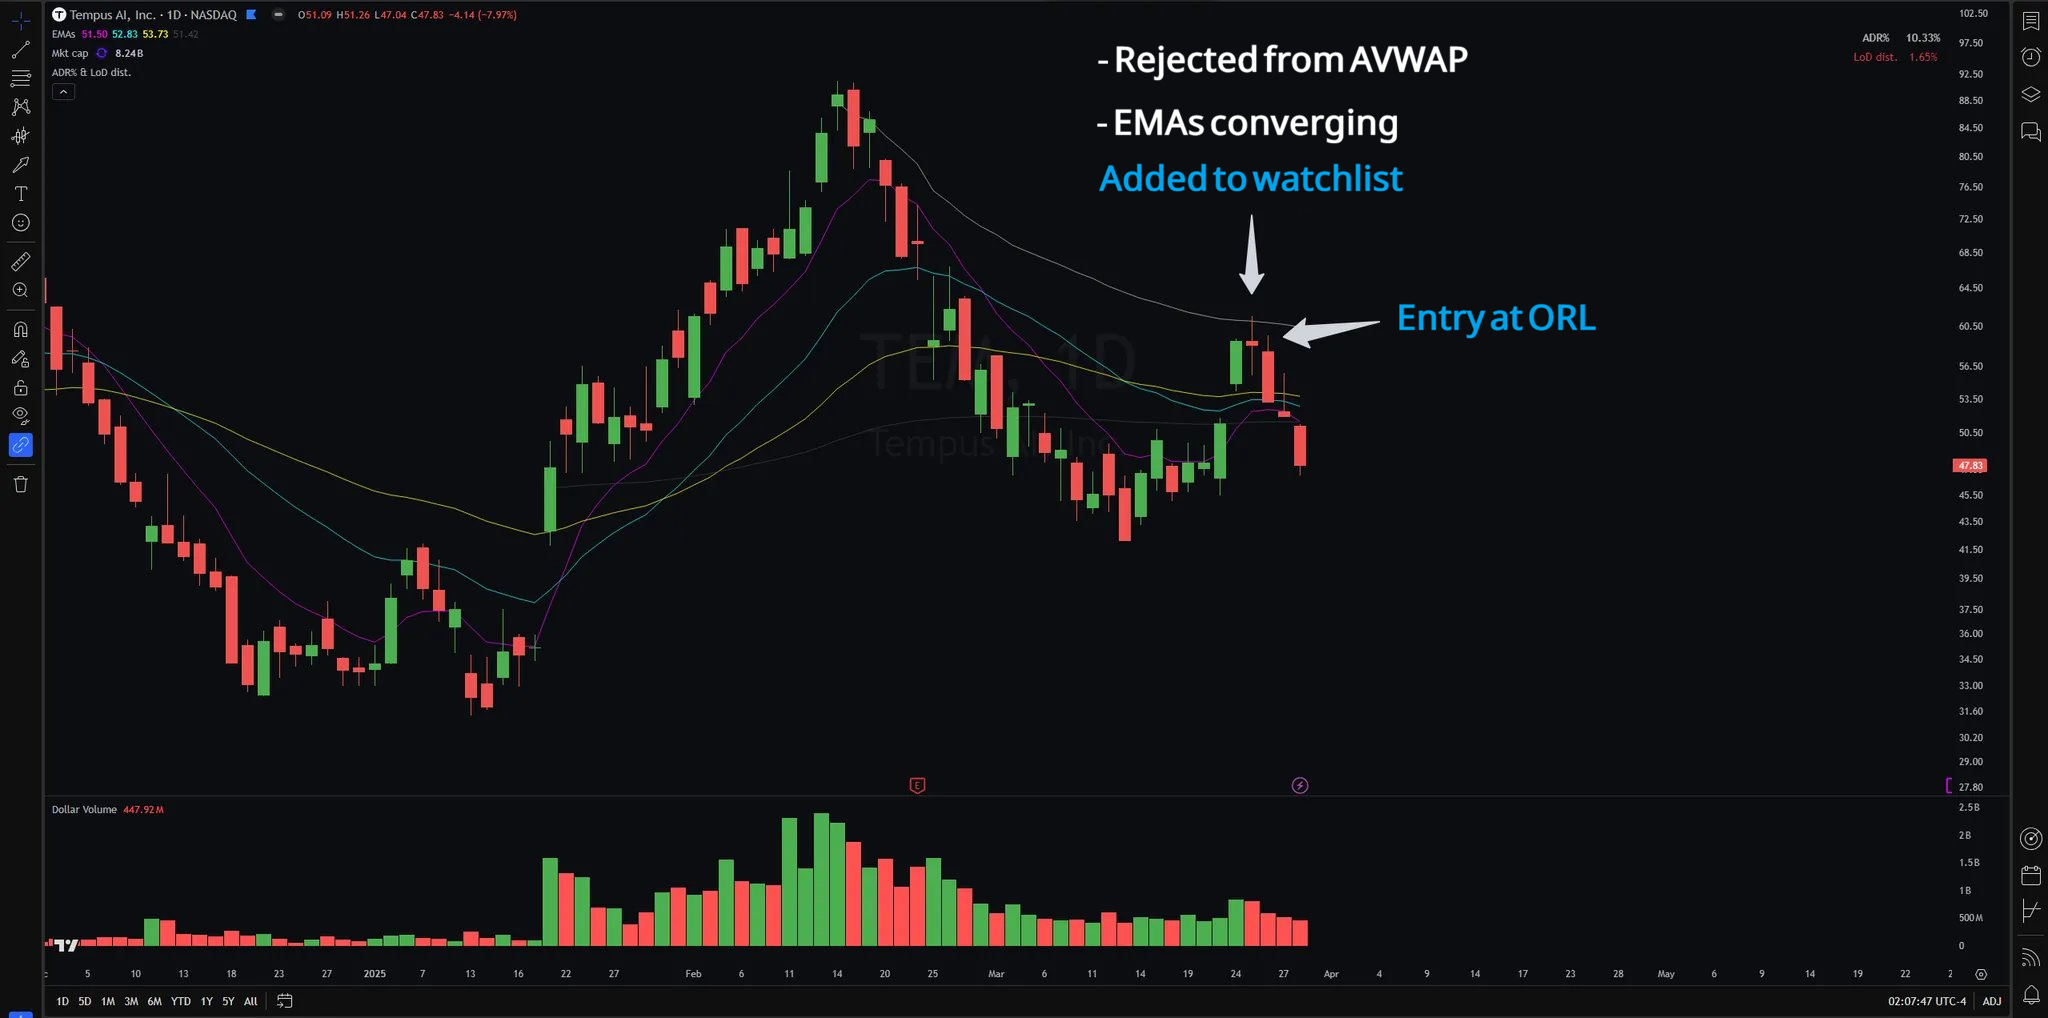
Confirmation on the lower timeframe — my two entry tactics:
1. Breakdown from the low of the previous hourly bar.
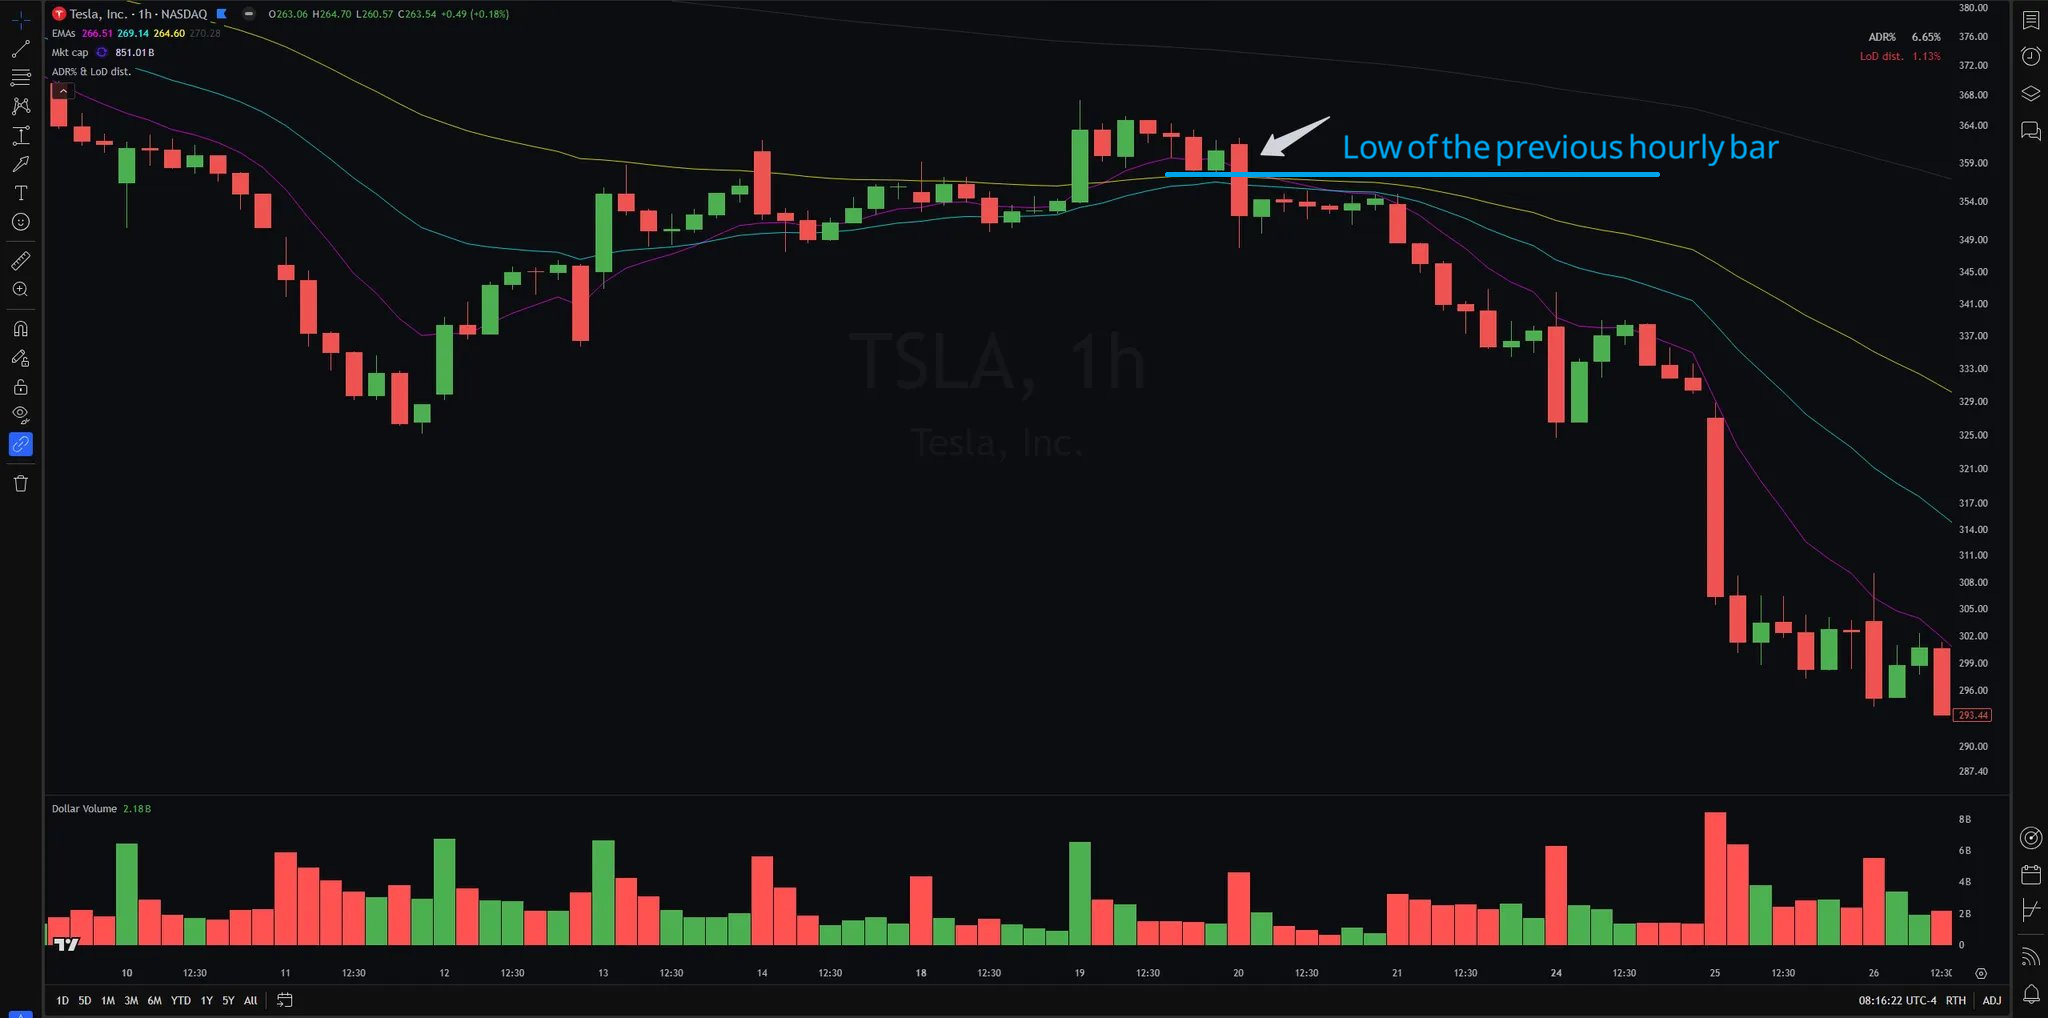
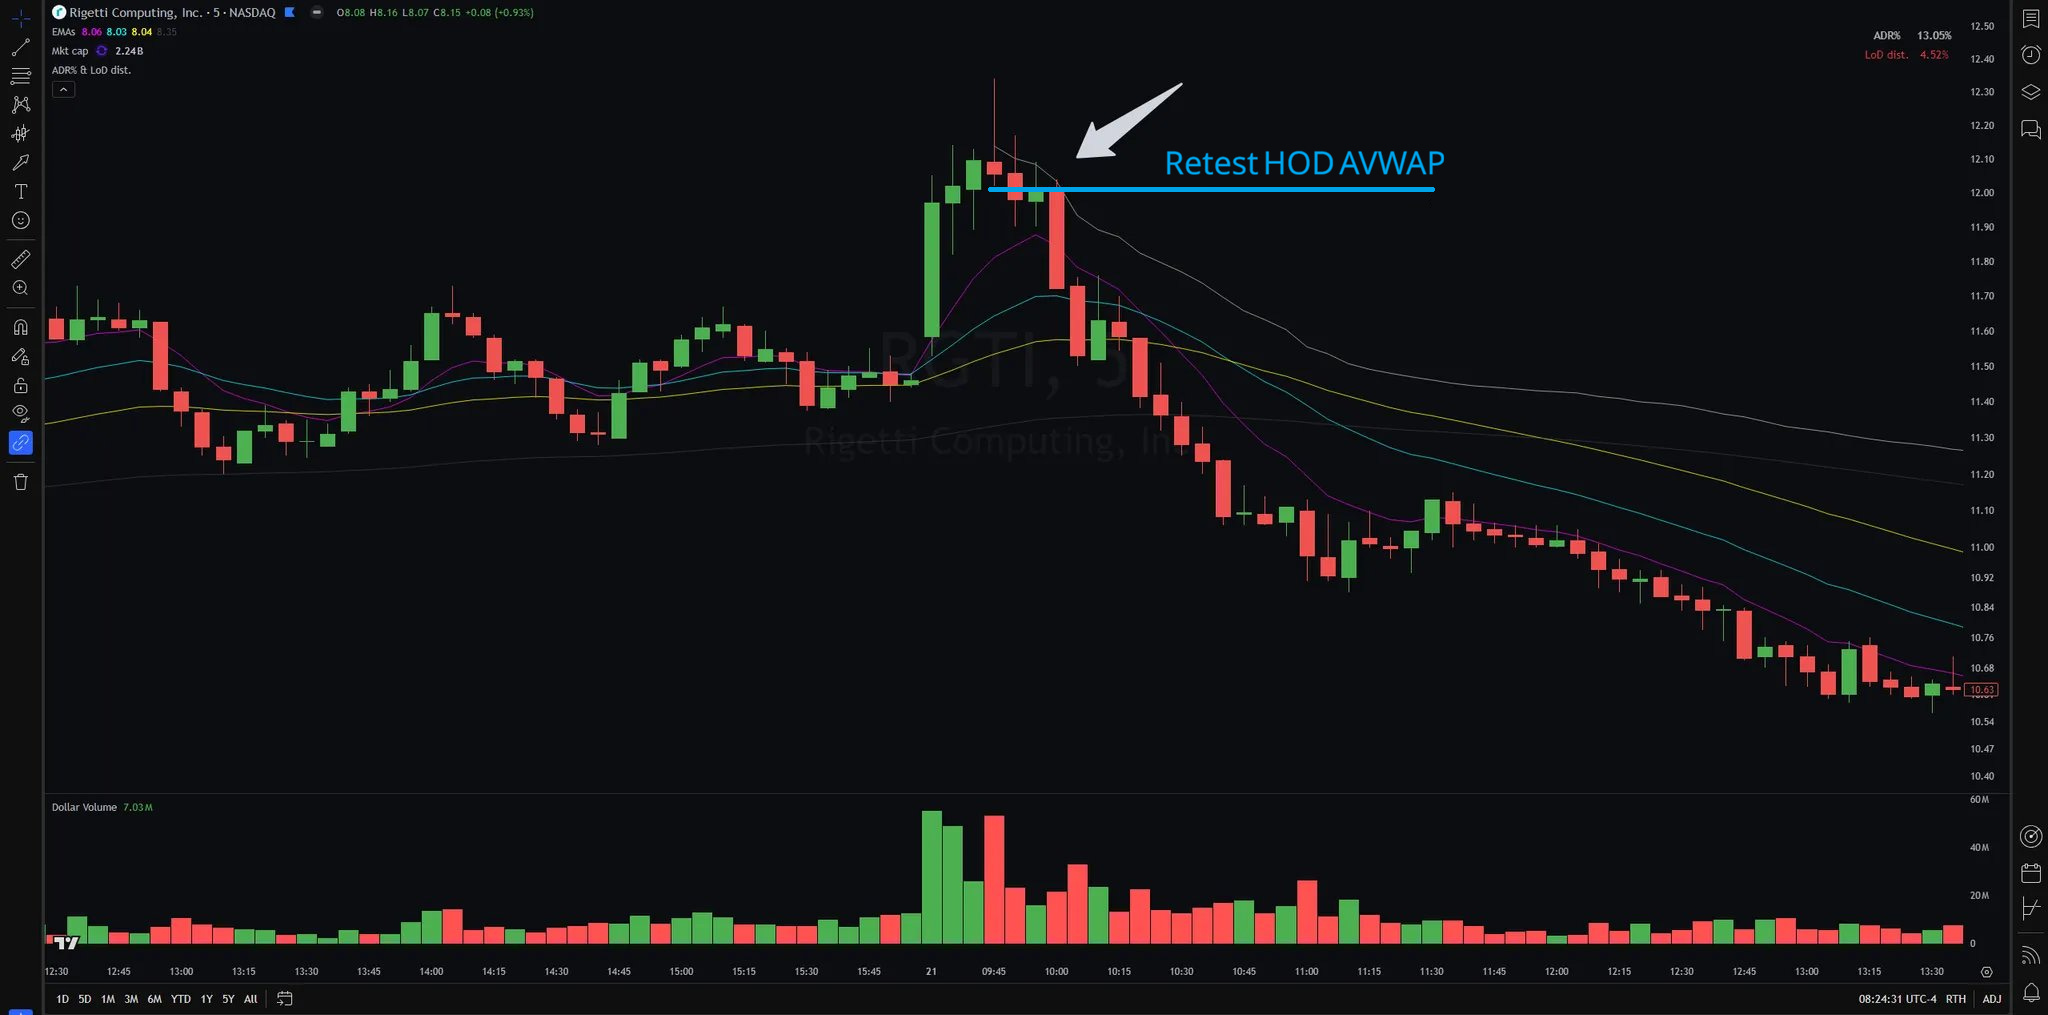
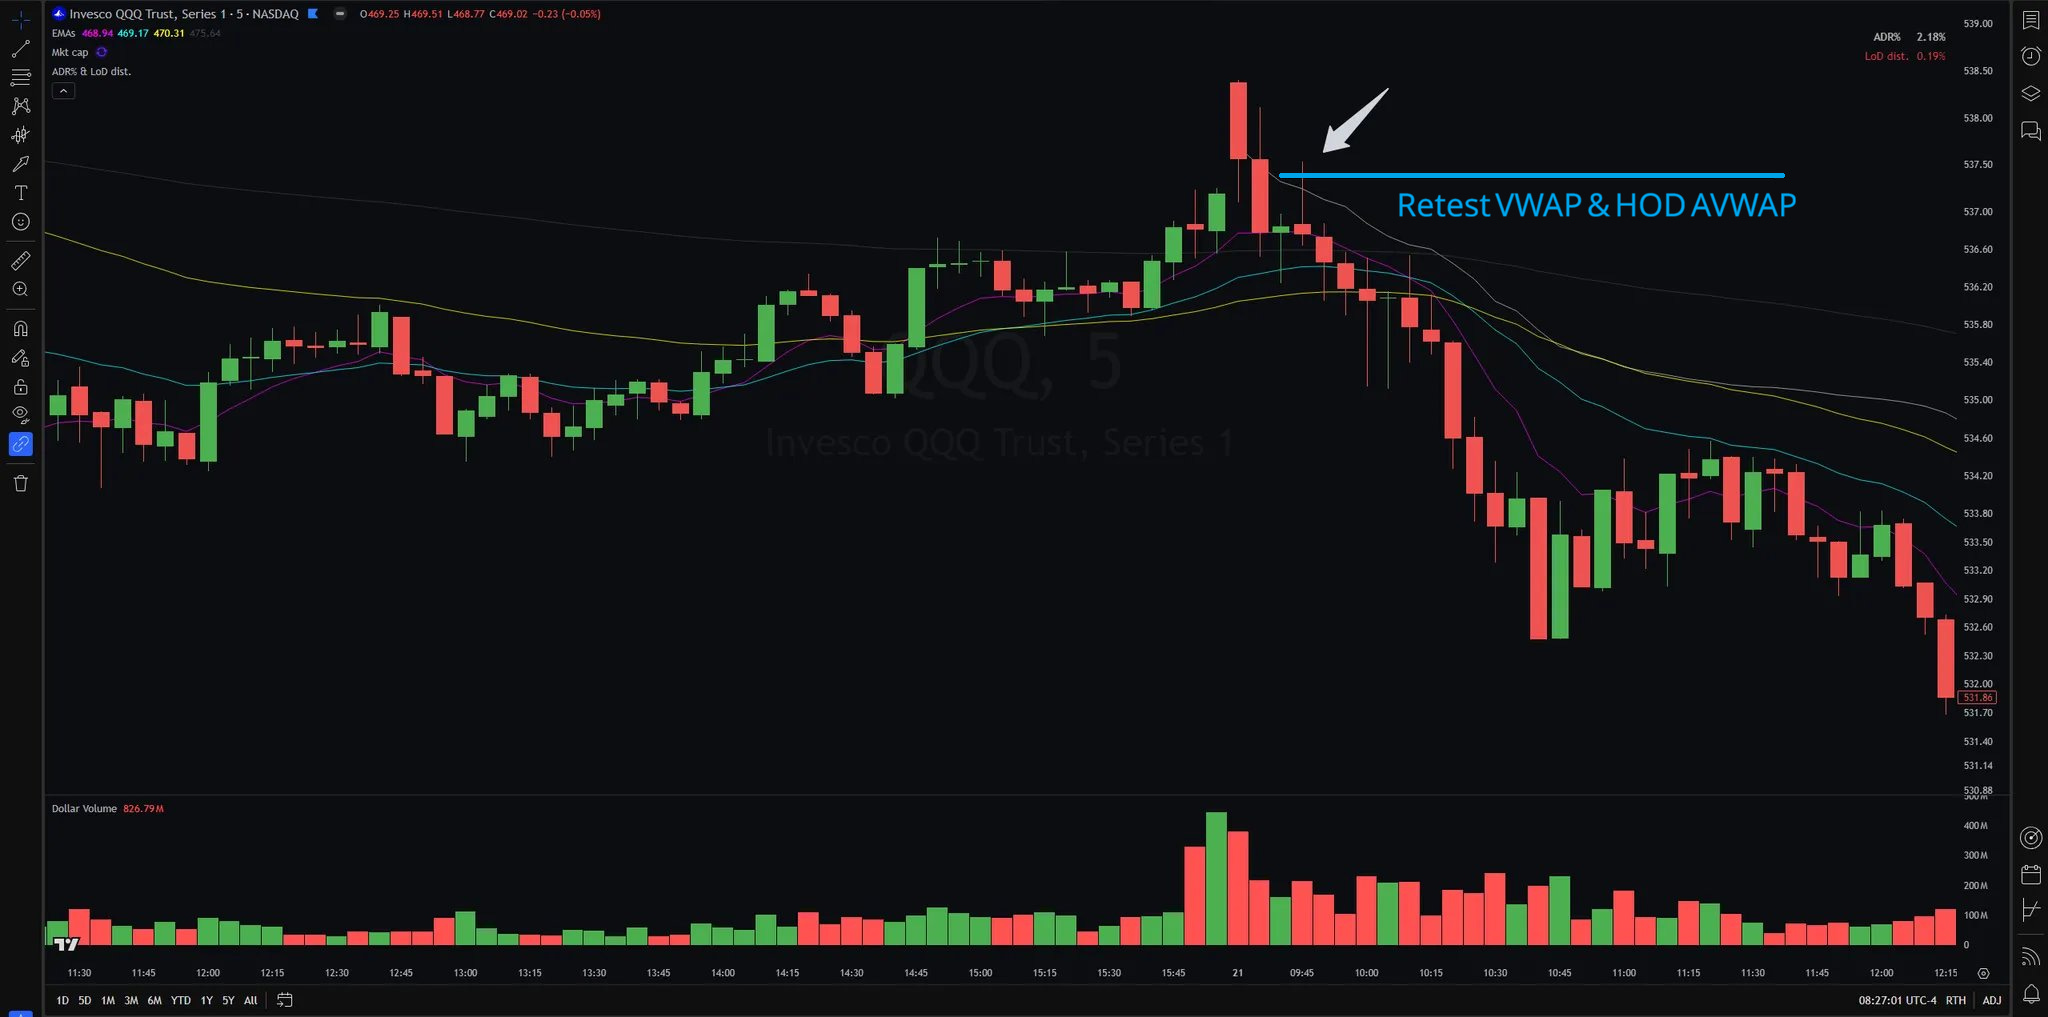
2. Intraday retest of the VWAP or HOD AVWAP.
Kyna: This article I’ve written with Brian Shannon explains more ways you can trade with multiple timeframes, using the principles Martin applied here.

The higher timeframe identifies a level of interest (potential support or resistance). The lower timeframe allows you to execute with more precision, optimising your risk–reward.
History doesn’t repeat, but it often rhymes.
Your task is to learn how history rhymes.
𝐍𝐎𝐓𝐄
The approaches I’ve shared aren’t hard rules. Plus, I’ll likely fine-tune them over time. Most importantly, these are techniques I feel comfortable using.

You need to find what works best for you by doing your own deep dive.
PART 2: Q&A FOLLOW-UP
(Kyna again.)
On 15 December 2025, Martin talked about his study process while streaming (13:40):
Definitely check out Martin’s streams if you want to learn more about his processes. They’re all available on YouTube.
To keep this stack self-contained, I asked Martin a few follow-up questions to his write-up above.
This maintains the style used in this study series so far. Not adding much to his first draft (just polishing it) also better captures how Martin thinks — something I always try to preserve with every guest.
~
When you started studying the 2022 bear market by typing in tickers, then studying the charts, how did you select stocks? And how did you select the historical charts?
My trade journal contains all the tickers I’ve traded since 2020. I typed in those tickers, then looked at each individual chart.
When studying the names I traded, I don’t limit myself to 2020 and later. Instead, I go all the way back and look for any prolonged downtrends since the stock IPO’d — for example, back to 1986 for $MSFT and 2010 for $TSLA.
~
What about the stocks you’ve never traded?
Most stocks I’ve traded are tech and fast-moving names, so it’s more efficient to focus my study on those rather than spend time on names I’ll probably never trade, like utilities and consumer staples.
~
Throughout your studies, the questions you asked yourself were quite specific. Is this specificity key to an effective deep dive?
Yes. Ambiguity and second-guessing dramatically worsen your decision-making.
If you don’t even know whether to use the 1-minute bounce into the declining 9 EMA or the 15-minute close below the VWAP when you’re trading in hindsight, how can you react quickly and decisively when trading a live market?
Specificity improves decisiveness. Decisiveness elevates execution.
~
When you flip through charts to study a specific phenomenon or answer a specific question, how many charts does it take to start seeing patterns? And how many charts does it take before you feel confident about your findings?
It took me no more than five charts to come up with the idea of shorting at resistance.
However, shorting every bounce into the declining EMAs isn’t profitable, so the difficult part is optimising the execution details. Specific questions like these are much harder to answer:
When is the best time to enter shorts?
Which EMA works best?
Does closing above the EMA during the bounce affect the win rate?
Does the duration of the bounce matter?
How do I define an intraday entry when the stock starts to reverse?
It took me more than 200 charts to come up with a comprehensive answer.
~
Do you have anything further you intend to study around short selling or trading reversals?
I want to study how much the win rate of trading reversals would increase when the $QQQ and $IWM stay under a certain EMA — the 9, 21 or 50.
~
Do you capture the charts you study in a database or model book?
I used to save charts of breakouts and EPs in a private Discord server, just for myself.
Over time, I lost the habit as I realised I rarely revisit the charts I’d saved there, so didn’t capture any charts during this study.
~
Do you just rely on observational studies, or also confirm your observations with quantitative data?
For this study, I didn’t include quantitative data as it’s too time-consuming and doesn’t add much value to the overall conclusions.
Plus, in many situations, it’s difficult to accurately quantify the conditions. For example, it can be complicated to determine which EMA is primarily responsible for a reversal when the price is close to multiple EMAs or trading right between them.
~
The focus of this shorting/reversal study was finding a good entry in terms of risk–reward, but you didn’t bring up stop losses or sell rules. Is that because you’re using the same ones as for long trades, but in reverse?
Yes, I simply reverse my sell rules for my long trades. So, I place my stop loss at the high of the day or at the high of the breakdown candle, with a typical range of 1.5–5%.
My portfolio risk per trade is 0.5%, and I don’t take more than a 35% position size. I tend to trade higher ADR names with smaller size. I also take less portfolio risk when testing the waters or not gaining traction.
I only treat shorts as quick swings, not home runs — I’m not willing to trail a short for weeks or months, but take profit more aggressively:
Trim ~15% when up over 3R.
Trim ~15% at potential support levels, like the previous swing lows, EMAs or AVWAP.
Exit if I subjectively feel the stock is extended or if the hourly bar closes above the 50 EMA.
As always, these aren’t hard rules.
PART 3: KYNA’S TAKEAWAYS
1. Martin’s efficiency when studying.
“One thing I really like about studying charts is the ease of access. Simply type the ticker. Press a few keys on your keyboard. That’s all it takes.”
“I ignore financial metrics when I study EPs — I find it too time-consuming to obtain and analyse the data.”
“I used to save charts of breakouts and EPs in a private Discord server, just for myself. Over time, I lost the habit as I realised I rarely revisit the charts I’d saved there, so didn’t capture any charts during this study of shorting.”
You can find more examples that highlight how fast Martin moves, removing any friction he deems unnecessary.
This doesn’t just ensure you move faster, but makes consistency easy — particularly when you haven’t yet developed the habit.
But how can such a simple study be so impactful?
2. The ‘hidden’ depth: Martin’s understanding of market structure.
(And lessons from Brian Shannon.)
Consider Martin’s starting point:
“Late December 2024, the market was whispering to me. The signs were unsettling. Alarming, even. More and more breakouts were failing. Stocks were losing key moving averages.”
“As the market had been edging up since January 2023 without a deep correction and the market sentiment remained overwhelmingly positive, I believed a correction was likely around the corner.”
Then, think about how quickly Martin noticed stocks decline at resistance, later followed by a link to Brian Shannon’s work:
“Every trend on a longer timeframe begins with a trend on a shorter timeframe, in both directions. That means every reversal on a longer timeframe originates from a breakdown on a shorter timeframe. […]
“You gain an edge when multiple timeframes echo each other. After determining potential resistance in a higher timeframe, the lower timeframe must confirm it.”
Before I started working with Brian, I thought I had a decent understanding of market structure…
…but Brian forced me to go deeper.
We humanised the market cycle, which highlighted nuances I’d never previously considered — yet in spite of all those details, the underlying structure had never seemed simpler. It’s all based on varying degrees of greed and fear.
We’ve also dug into the technical details of each stage and sub-stage. This process was intense. Glossing over details wasn’t acceptable, so I spent considerable time questioning — and resolving — any (apparent) inconsistencies I discovered.
I realise this is the opposite of Martin’s approach: it’s high friction. But if you can maintain that friction, it becomes part of your edge.

The real secret is to find what aligns to your personality, then double down on it.
I went from thinking I didn’t understand market structure at all, to having multiple ‘aha’ moments in short succession. For example, I realised how:
Early trends (both up and down) tend to have not just lower fail rates, but also shallower pullbacks.
Mid-trends are often the ‘sweet spot’, because that’s when technicals and fundamentals tend to align.
The slope of the moving averages can also tell you a great deal about the maturity of a trend.
Continuation gaps often represent an acceleration of an existing trend.
This is far from exhaustive (I’m not stealing Brian’s thunder). And you might think all the above obvious. Reading it, I do too — but much of the above didn’t truly ‘click’ until I did my own (writing-based) deep dive into the topic.
When you discover and articulate market behaviour for yourself, and don’t depend on someone else’s insight, you start to internalise it.
You realise how the market cycle is just an endlessly repeating process of range expansion and contraction, on every timeframe.
From the ‘big’ stages as per Stan Weinstein’s framework, to the corrections within a larger trend, to even the intraday action, the market contains multiple “trends within trends” (Brian’s words).
Each trend is driven by greed and fear — which are also the emotions that eventually halt trends. The further price moves in your favour, the greedier certain participants get. Meanwhile, other participants become more fearful about giving back profits, so are keen to lock in gains. Once supply overwhelms demand (or vice versa), the trend neutralises and ultimately reverses, triggering further selling.
“Humanize the charts” has become my favourite quote from Brian. Because learning to do just that is what deepened my own understanding of market structure.
Why explain all this among my takeaways from Martin?
Because in Martin’s writing, I can see how he already understood all this — and how it was directing his studies.
His solid foundation of market structure allowed him to move through the different steps of his study clearly and with precision. And once he had an idea, triggered by revisiting Brian’s 2021 presentation, he could connect it to other ‘files’ in his ‘mental database’.
This existing framework — combined with pattern recognition skills — enables Martin to ask specific questions, improving his decisiveness and elevating his execution.
3. Risk management starts with a good entry.
When reading Martin’s first draft, I was struck by how much he focused on entries alone.
In the Q&A, he confirmed that’s because he was otherwise using his existing rules — but when editing his write-up, I realised it’s also because he focuses on risk every step of the way. (Something all top USIC performers do.)
Good risk–reward starts with a good entry:
Track the stock so you can anticipate the trade — notice Martin’s separation between a signal to add a stock to his watchlist, and the entry signal. This allows for precise execution.
Focus on the stocks already showing signs of weakness on the higher timeframe (for a short; look for relative strength for longs).
Get a precise entry through multiple-timeframe analysis — like how Martin looks at an intraday chart to ‘snipe’ his entry and keep his stop loss tight.
Martin further improves his odds by only trading stocks he understands (tech and fast-moving names). This improves conviction and, by extension, execution.
But don’t just copy Martin’s tactics and stock picks — find what works for you!
4. Proactively address issues.
Martin was self-aware enough to know he tends to overtrade, so looked for a solution to address it. Plus, he was unhappy with his shorting skills and his previous bear market performance, so wanted to improve them.
This proactive mindset is ubiquitous among top performers. As Stockbee says:
“When you start thinking about solutions, the problem disappears or looks small.”
Everyone has problems. But if your current problems are different from your previous problems, you’re growing.
A simple mindset shift to not think in statements (“I can’t do that”) but in questions (“How can I do that?”) enables you to achieve so much more.
As Martin demonstrates, it also allows for specificity:
“Specificity improves decisiveness. Decisiveness elevates execution.”

Martin’s remarkable achievements at just 23 years old are likely the result of his ability to quickly recognise and learn from his mistakes — something he already demonstrated in his first guest post.
If you’re going to copy anything from Martin, make it his proactive mindset — from not letting problems hold him back, to just getting started, then refining later.
- Kyna
P.S. Collaborations like this take significant time to coordinate and edit. If you find value in these deep dives with top performers, you can support future work.


Phenomenal stack, the time and effort put in this one is incredible will need to reread a few time to fully absorb everything.
Thanks a lot Martin and Kyna
Fantastic article Kyna & Martin - i greatly appreciate the detail shared.
Just to further cement the learning process thats discussed, Mike Webster often talks about William O'Neils process of building a model book in his WRO series on Youtube. WON used to study a complete chart after the move, and mark "X" as the best entry and "Y" as the exit. However if studying charts this way, you'll miss out on the fluctuations of bar-by-bar practice; the big gap ups, the undercuts that run your stops, the multiple attempts to get positioned that it will likely take...the benefits of 'going deep' are great and readily available these days as Martin mentioned
I can also completely emphasise with Martins comments on his discord server that he used to save charts too. I've build a pretty good model over the last few years, but always struggle to find the balance between revisiting and studying past charts and doing other things. Currently using some blocked time on my calendar every week to so, but with mixed success!