
How to Use Moving Averages in Different Environments
Collaboration with Francesco (@FranVezz) and Clement Ang

NEW: MENTORING WRITERS
Once a month, I’m going to hop on a free 60-minute call with a random reader, who can ask me anything about writing and learn how to improve their free Substack (or other free publication). More information.
PART 1: KYNA’S MISTAKES & PSYCHOLOGICAL BENEFITS OF SELLING PARTIALS
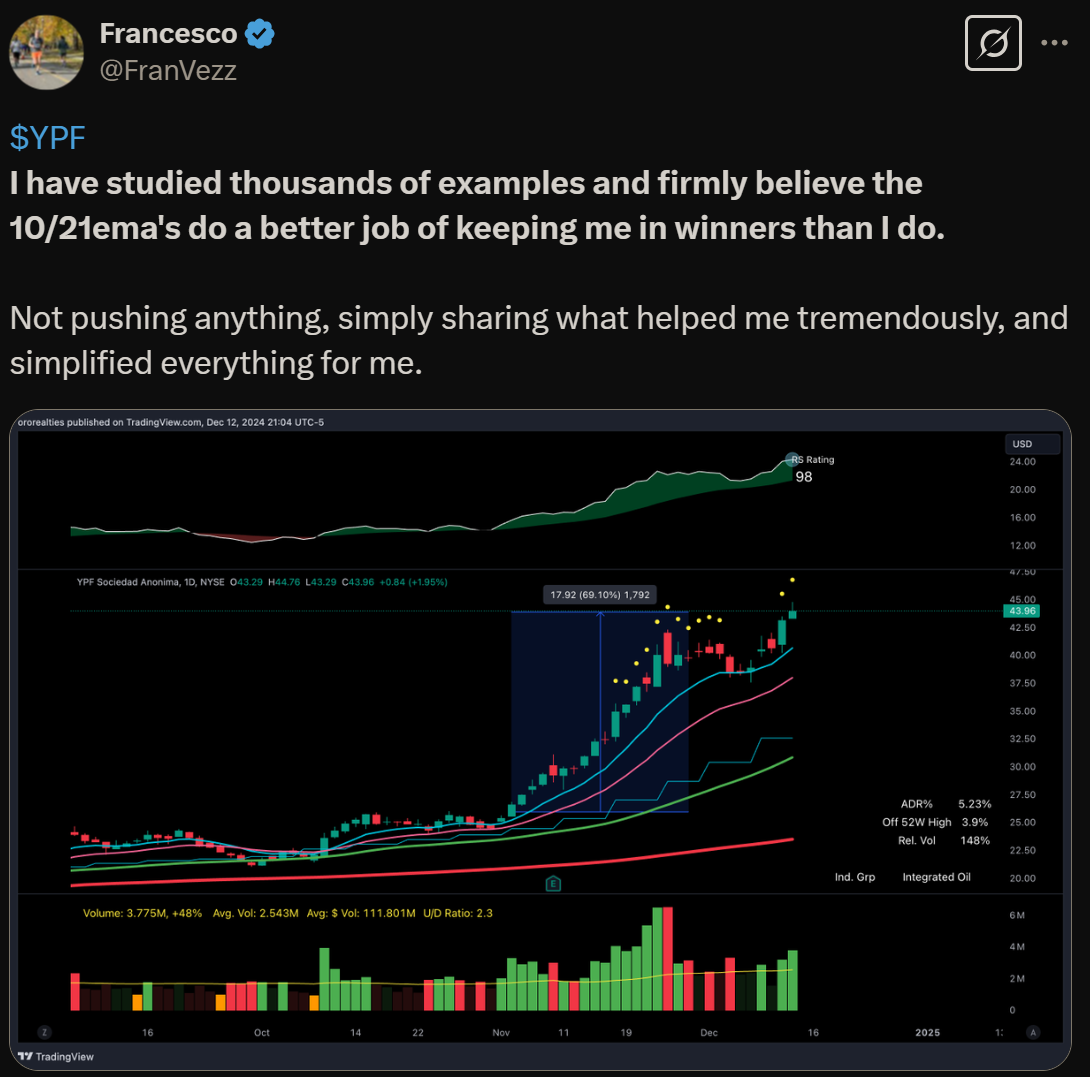
Back in January, I scheduled a tweet with some Qullamaggie wisdom relating to moving averages (MAs):
But I picked an unfortunate day for this particular scheduled tweet, so quite rightly got ribbed for it.
(The truth is that I’d forgotten about this tweet until after it got posted!)
This doesn’t, however, take away the value of the MAs. Far from it.
From an early stage of my trading journey, I’ve heard many traders speak of how you should sell partials.
But for years, this didn’t quite make sense to me. It seemed like a cop-out:
Either you believe the stock can go higher…
…or you believe the risk outweighs the reward, in which case it’s profit-taking time.
This was reinforced by Tom Dante repeatedly pointing out: “There’s no such thing as a free trade.” (Meaning that if you’re ‘freerolling’ a trade, you’re actually risking the difference between the current price and your current stop.)
What I failed to account for was timeframe.
Tom’s timeframe is considerably shorter than the strategy that I was learning: swing trading off the daily timeframe. If you want to hold winners for a few weeks, you must sit through pullbacks.
I also failed to grasp that the point of selling half (or a different partial) isn’t indecision, but getting two practical benefits:
You reduce your position size to reduce unrealised profit volatility.
You free up funds for new opportunities as the market continues to shape up.
The above only ‘clicked’ for me late last year thanks to Jeff Sun.
Jeff also explained the psychological benefits:
“As your equity grows (especially when it surpasses your absolute dollar risk tolerance relative to your monthly expenses), seeing unrealized profit drop from, say, +$500,000 to +$280,000 in a single session can be hard to handle, even if you’re following textbook rules.
“I believe not many can emotionally withstand holding 8–10 full-sized trades with 80% portfolio utilization, especially when trading with a bankroll that significantly impacts their quality of life and that of their dependents.”
This comes back to understanding the ‘why’, not just the ‘how’!

To deepen our understanding of moving averages and how to use them, I asked
— a mega fan of MAs — to elaborate. For his starting point, I asked how he settled on his preferred MAs: the 10 and 21 exponential moving averages (EMAs).PART 2: FRANCESCO ON COMBINING & USING MAs
An early mentor introduced me to the 8 EMA.
Upon studying it, I felt it was a little too short term, so switched to the 10 EMA.
The 10 EMA helps me capture the initial, more powerful ‘burst’ of the move. But I also wanted something that:
Helped me stay in the ‘meat’ of the trend a little longer…
…without sitting through bigger pullbacks and long consolidations.
This led me to my intermediate trend tool: the 21 EMA — the perfect moving average to achieve this objective. It allows me to capture a larger risk multiple.
(I use exponential rather than simple moving averages because I like the more reactive nature of EMAs. If price action sours, the EMAs will respond faster, pushing me to a defensive sell if necessary.)
I backtested both EMAs with thousands of charts, and saw how the strongest stocks kept riding these moving averages.
Backtesting also made me realise that the real magic happens when these MAs come together.
Each serves a different role in securing partial profits. Think of it as a ‘partnership’, where each moving average looks to capture a different part of the move — the trend on different timeframes.
Here’s the thing:
We never know how far a stock can run.
Perhaps it’ll be a short multi-day move, which my 10 EMA will capture.
Or perhaps it’d be a large multi-week move. This is where my 21 EMA will keep me in the trend — see $RKLB as an example:
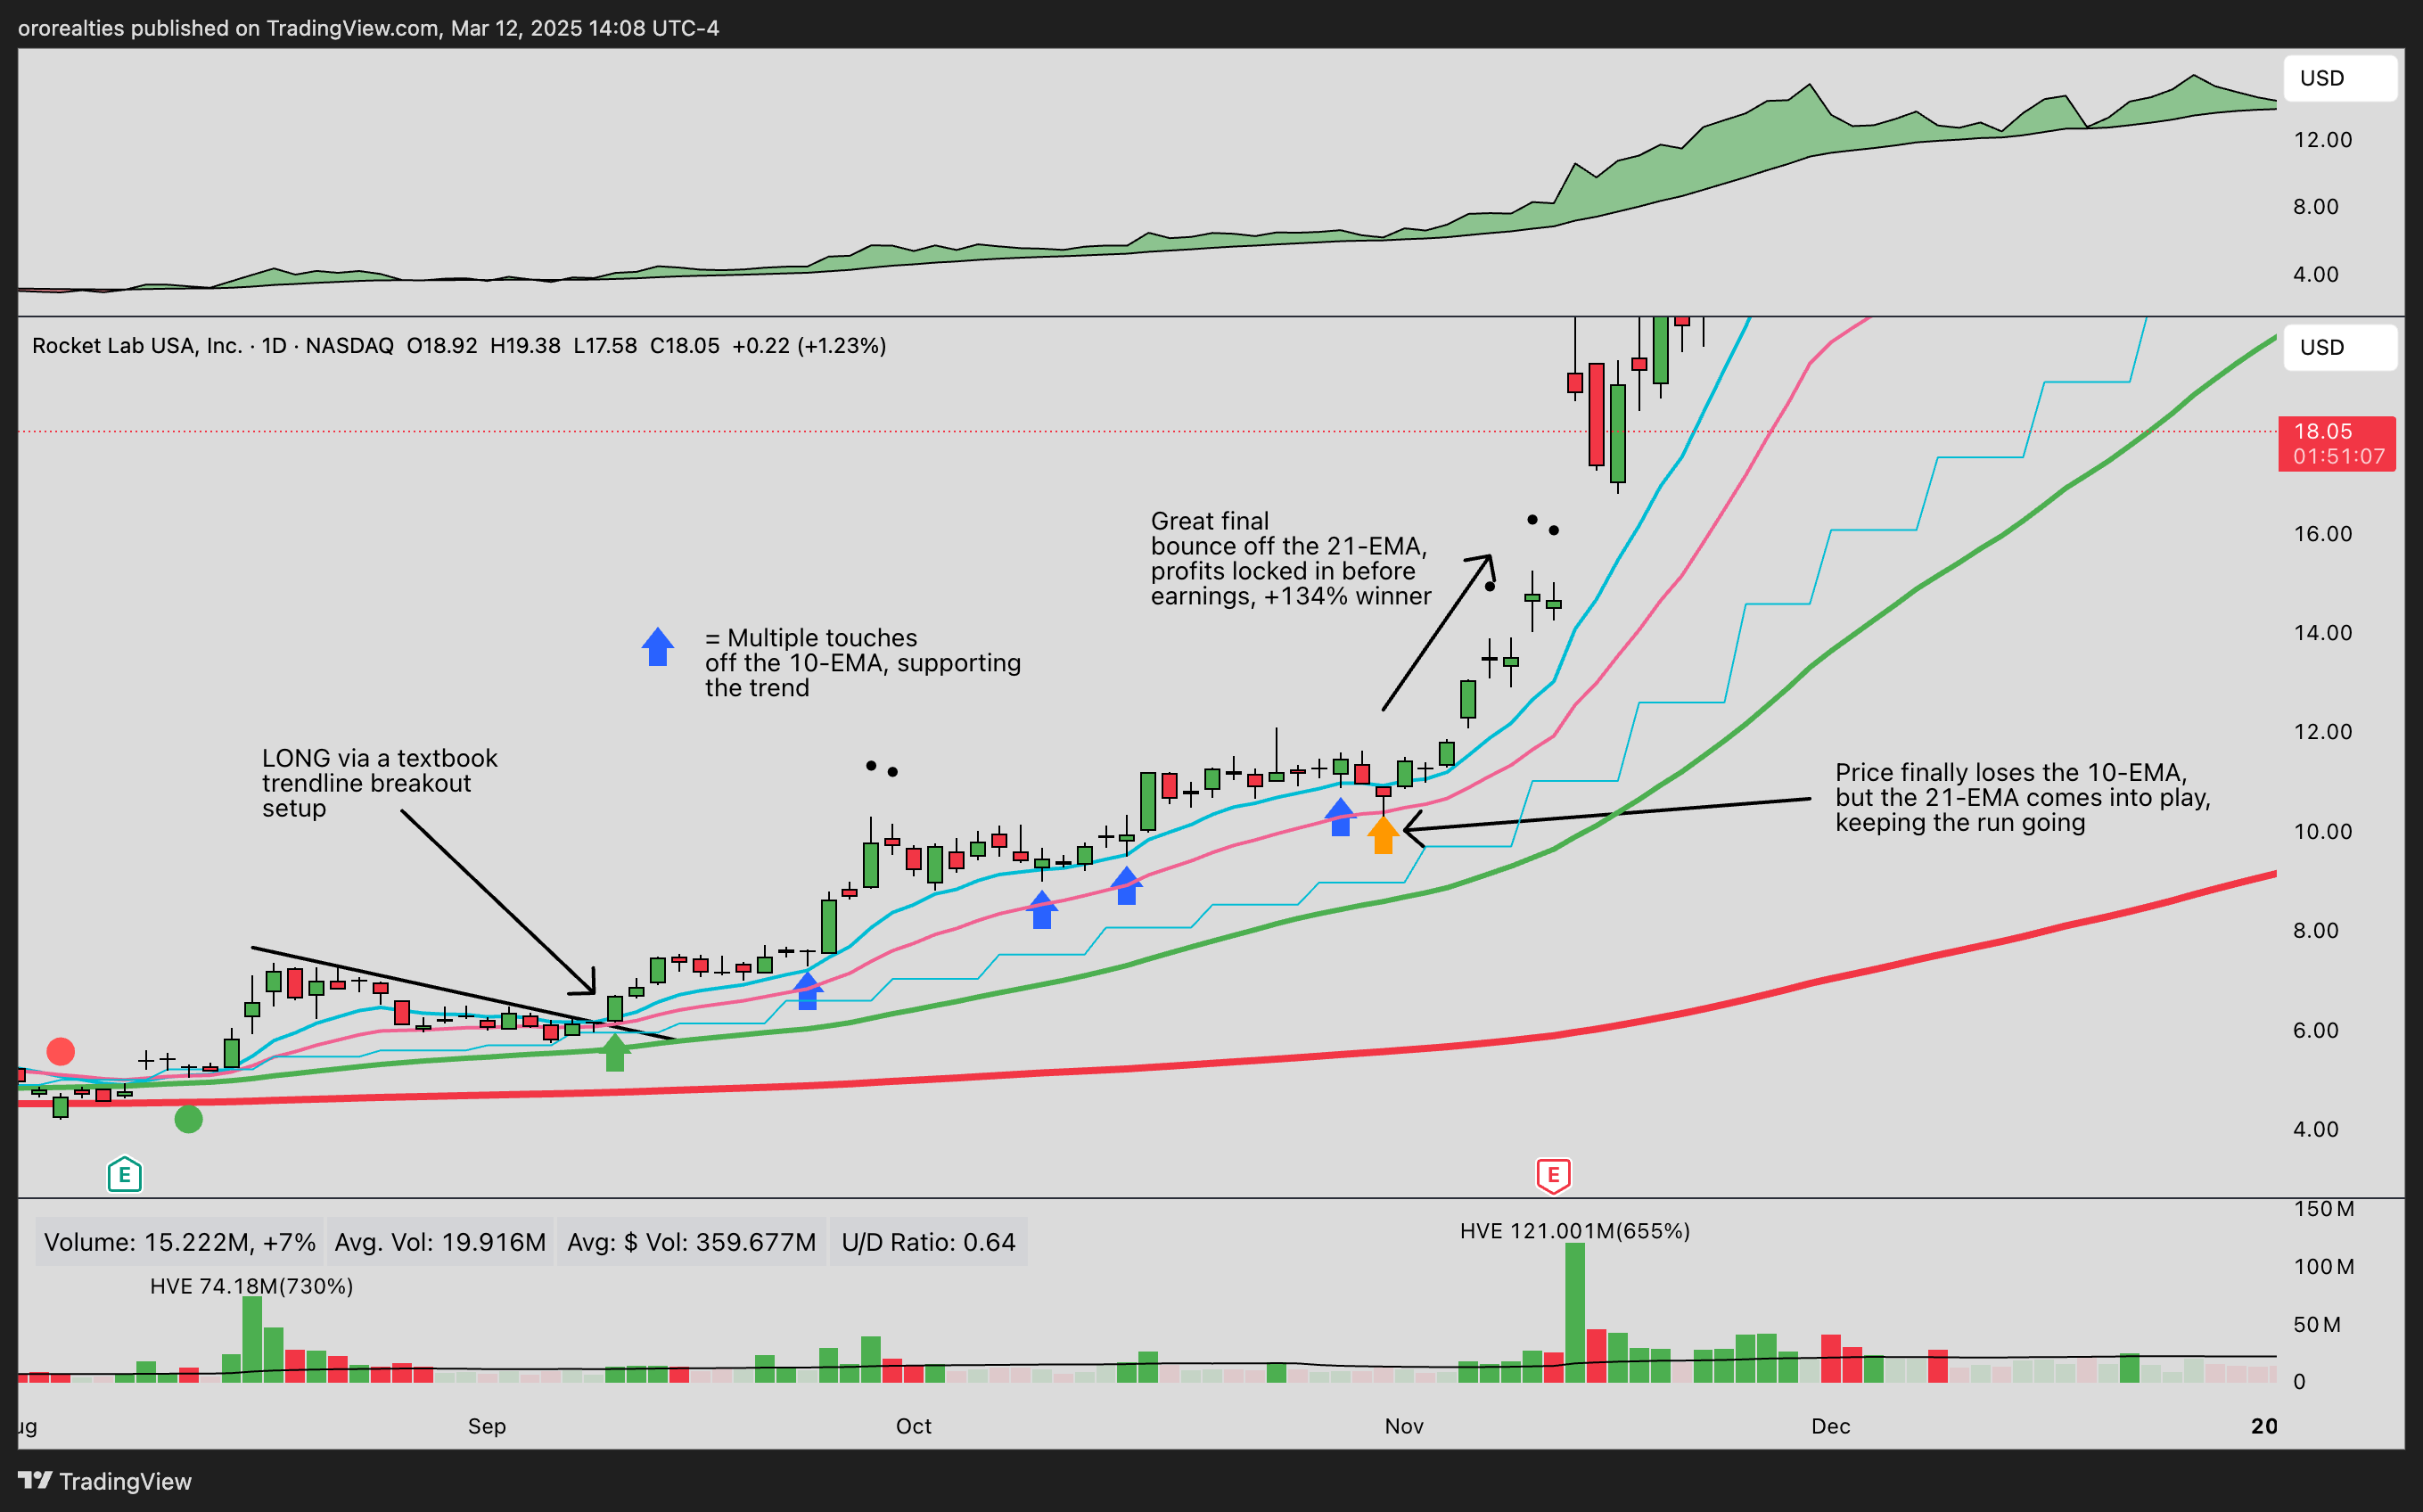
I like to use the 10 and 21 EMAs together because, on a net basis, this helps me capture a greater piece of the move.
Here’s $GGAL as an example:
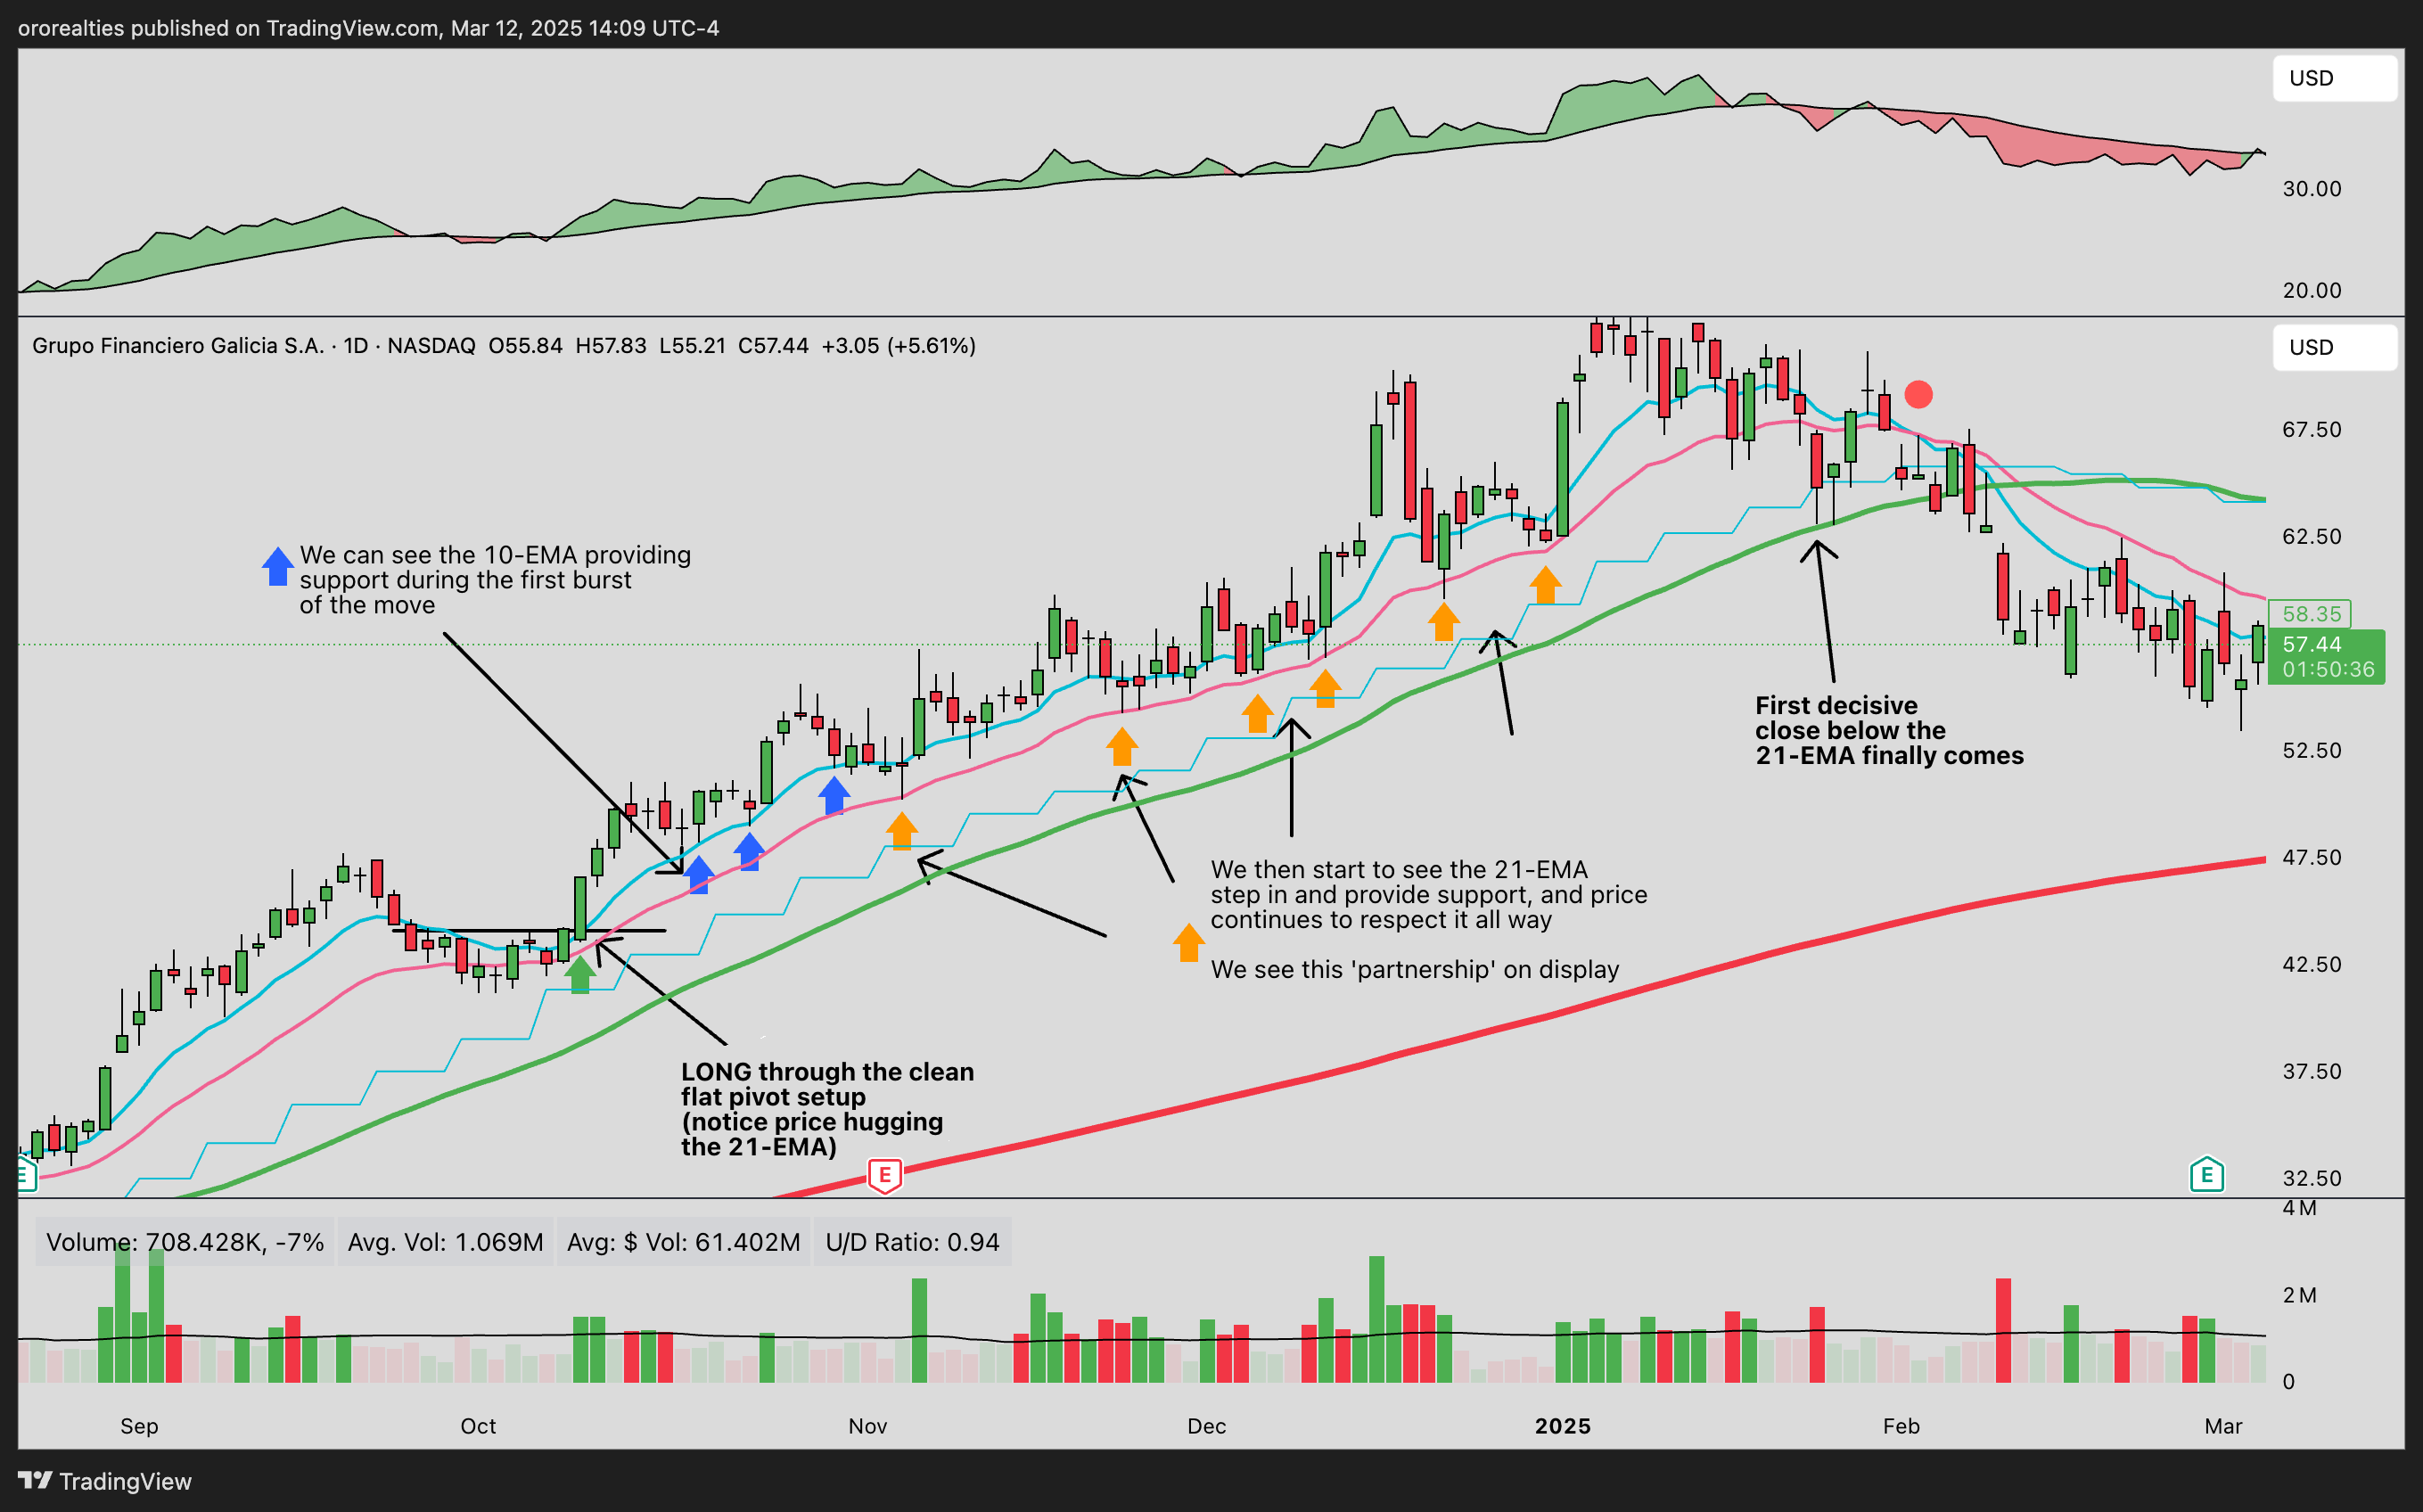
The market is random. We never know if our next trade will last a couple of days or a couple of months.
Trusting the MAs puts me in a great position to capture whatever the market chooses to give me…
…whether a small or a large move.
And once an MA is breached at the close, we may see consolidation or a short-term pause. That’s why I use a close below an MA as a signal for locking in partial profits.
Amidst the uncertainty of trading, MAs offer a simple, clear filter for me to look at charts without bias. At a glance, I can determine whether a chart is bullish or bearish.
I adhere to a simple principle:
Good stocks are above the rising MAs, and bad stocks are below declining MAs.
This ensures:
I’m always in rising stocks that show strength supported by an underlying trend.
The MAs are underneath my price — not above them — thereby adding a layer of support, further stacking the odds in my favour.
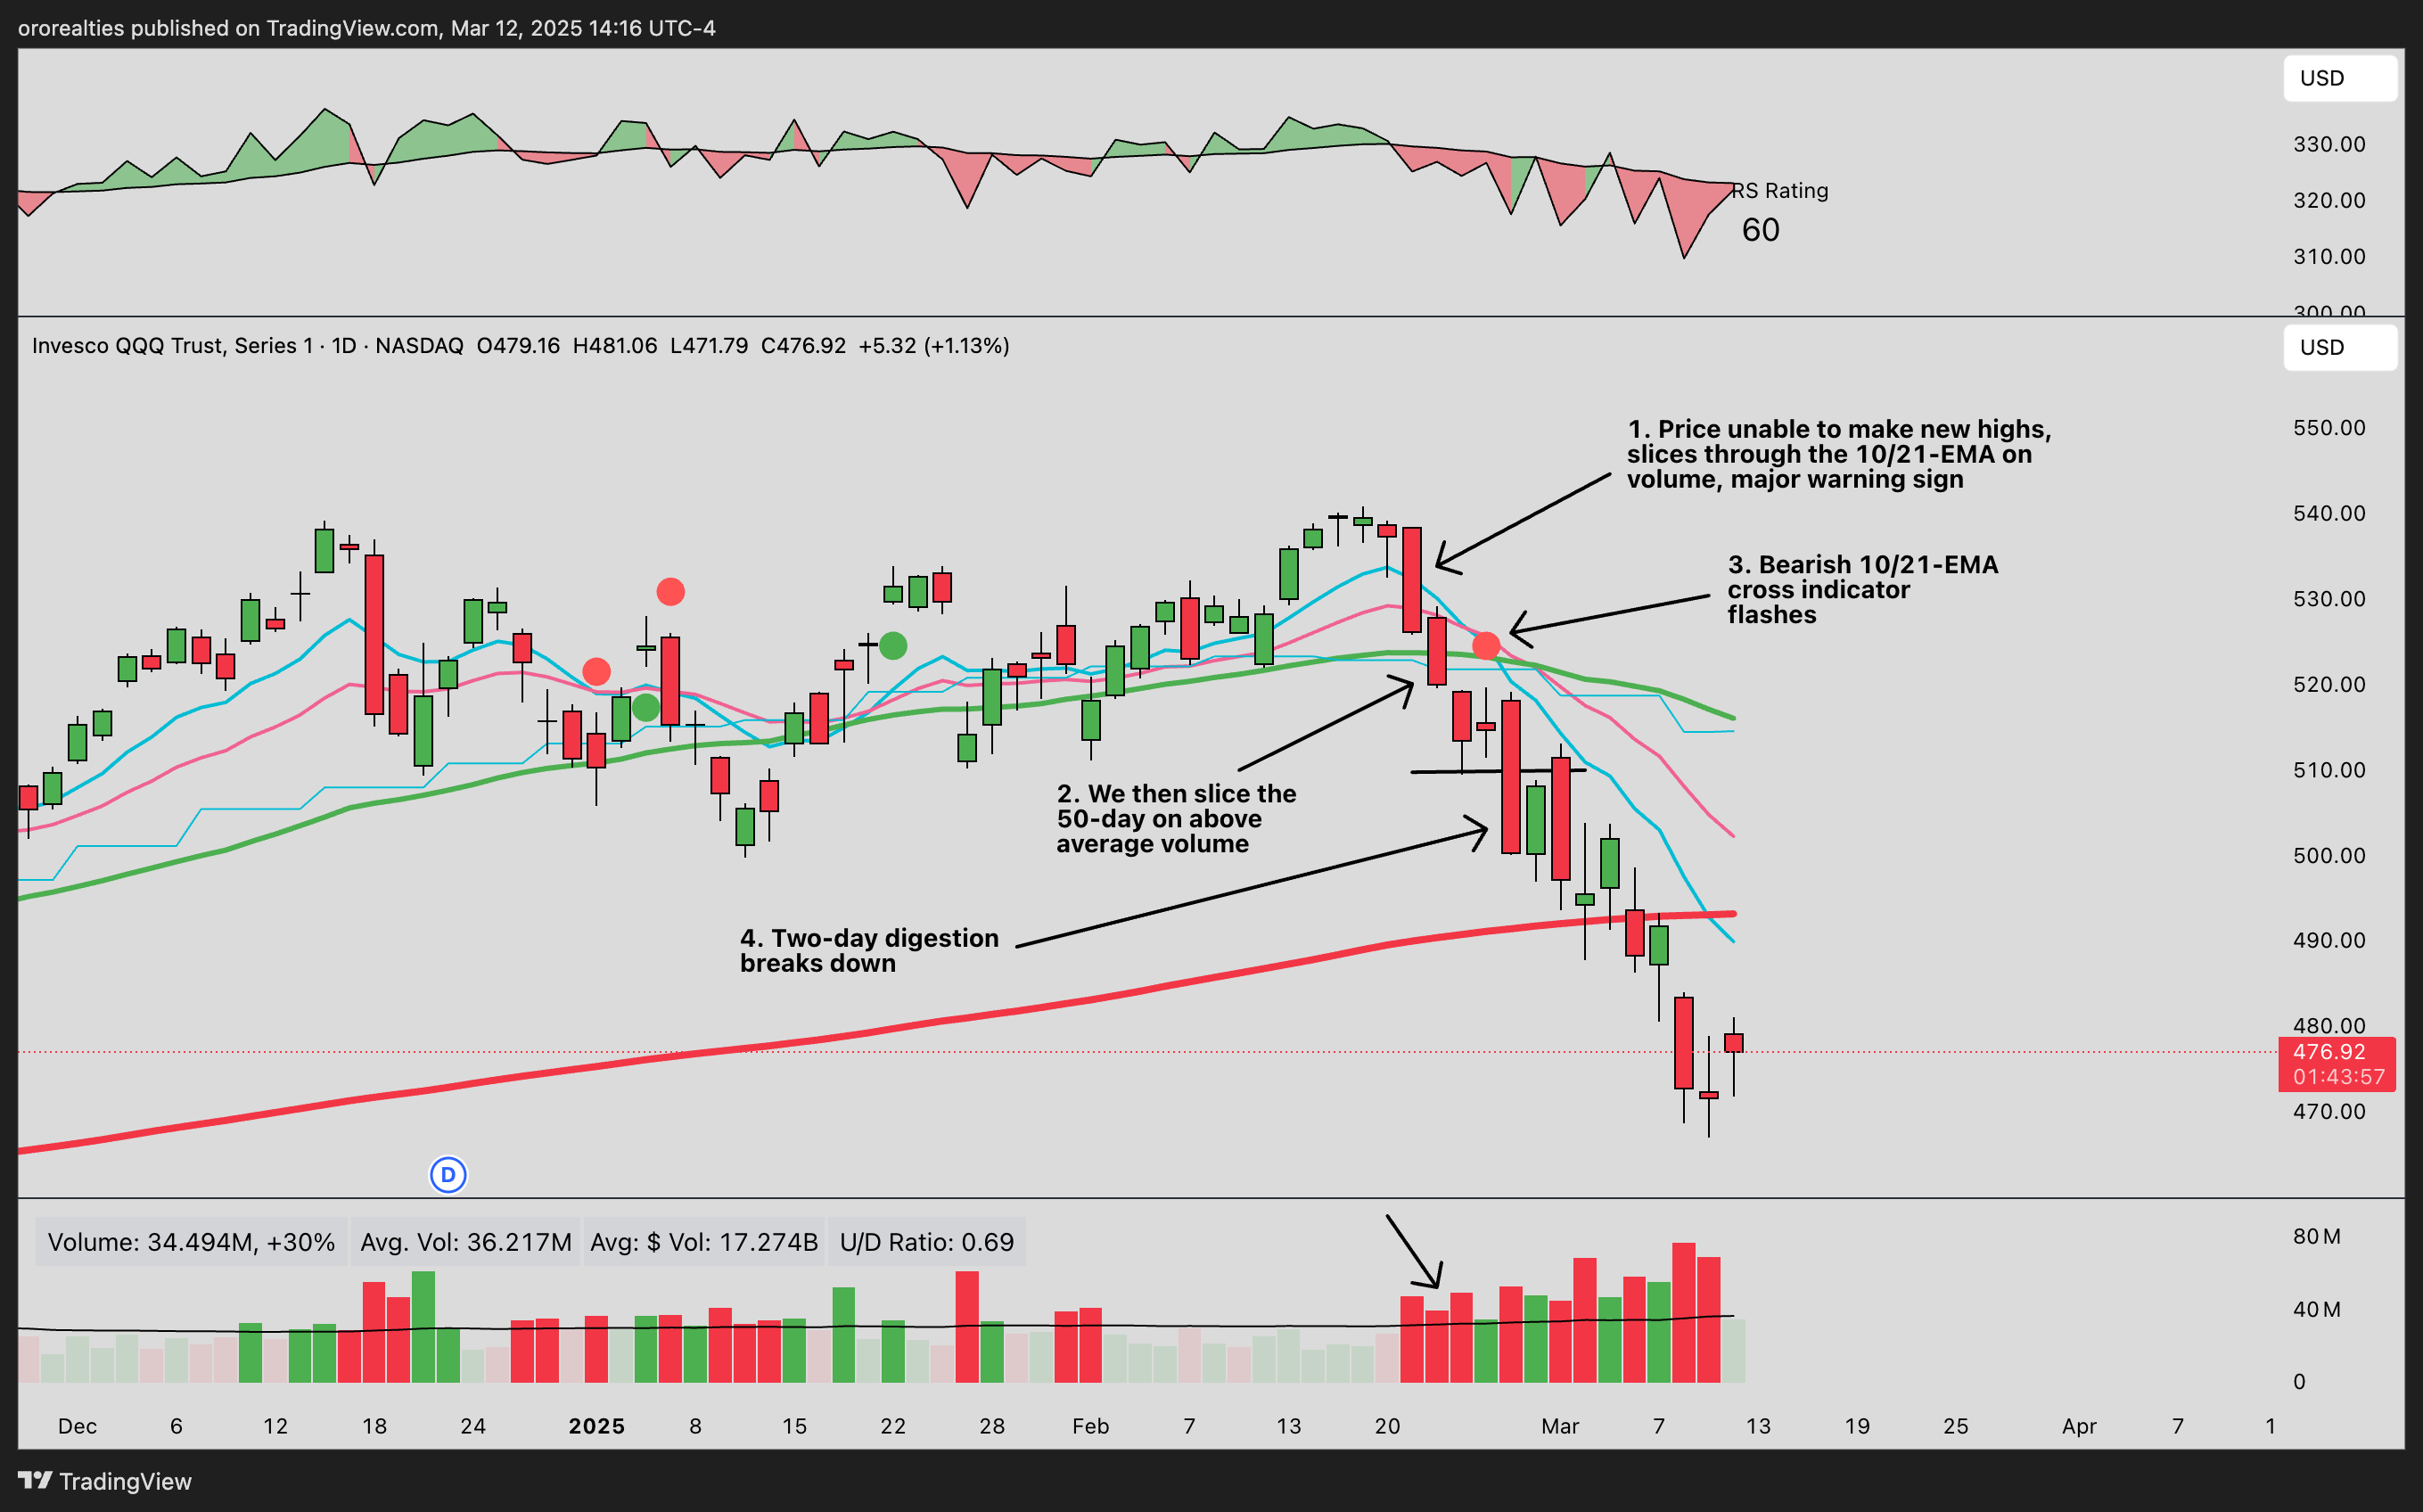
The MAs protect me from danger — not just by avoiding weak stocks, but by staying out of downtrends.
Here’s an annotated chart of the recent market ($QQQ) to illustrate:
Another major benefit to using MAs is their ability to remove emotions from the process.
How often do you see a stock have an ugly down day? Or pull back aggressively after a nice little run up?
Often, right?
As a newer trader, most of the time, I’d panic sell. I disregarded process, and failed to allow the stock to go through perfectly natural fluctuations.
As I started backtesting MAs, their power became abundantly clear to me:
Leaning on the moving average, and not my emotions, yielded greater results.
Instantly, I stayed in trades for longer, and started ‘riding’ winners.
So, I developed a simple rule of thumb:
As long as your stock is trading above a rising 10 EMA, it’s doing nothing wrong.
Hardwiring my brain to trust the moving averages, and not my emotions, proved an incredibly powerful decision.
[Kyna] The 10 and 20 (or 21) EMAs aren’t the only moving averages keeping traders out of trouble. Clement Ang has recently been inspired by Brian Shannon’s 5-day SMA (or ‘5 DMA’), and finding ways of adding it to his trading. I asked him to elaborate:
PART 3: CLEMENT ON HOW HE APPLIES BRIAN SHANNON’S 5 DMA
I’ve been reflecting on which interviews influenced me most as a trader.
One of them was Brian Shannon’s interview with Richard Moglen in 2021:
From 58:20, Brian talks about the 5 DMA.
I first watched the interview in 2022, during the bear market, so this concept really resonated with me. But I only began incorporating the 5 DMA in my trading in the second half of 2024. Things don’t go up forever, so I was preparing for a market correction.
While simple is better, as traders, we must also be adaptable.
In a better market environment, I like to hold stocks for longer, capturing more of the trend — that’s why I typically just look at the 10-, 20- and 50-day MAs on my daily charts — holding winners for several weeks. Perhaps up to a month.
But this year, my average holding time has drastically reduced, to 1–3 days — simply because that’s all this environment gives me. That’s why it made sense for me to take another of Brian’s lessons, and use a lower timeframe like a 65-minute, then plot the 30-period MA on it (which corresponds to the 5 DMA).
This helps you stay out of the market when needed.
Now, I see the 5 DMA as a useful tool for traders to add to their arsenal. It can offer another layer when you’re stacking the odds in your favour.
Notice, for example, how $QQQ double-topped as it broke the 5 DMA on 20 February 2025:
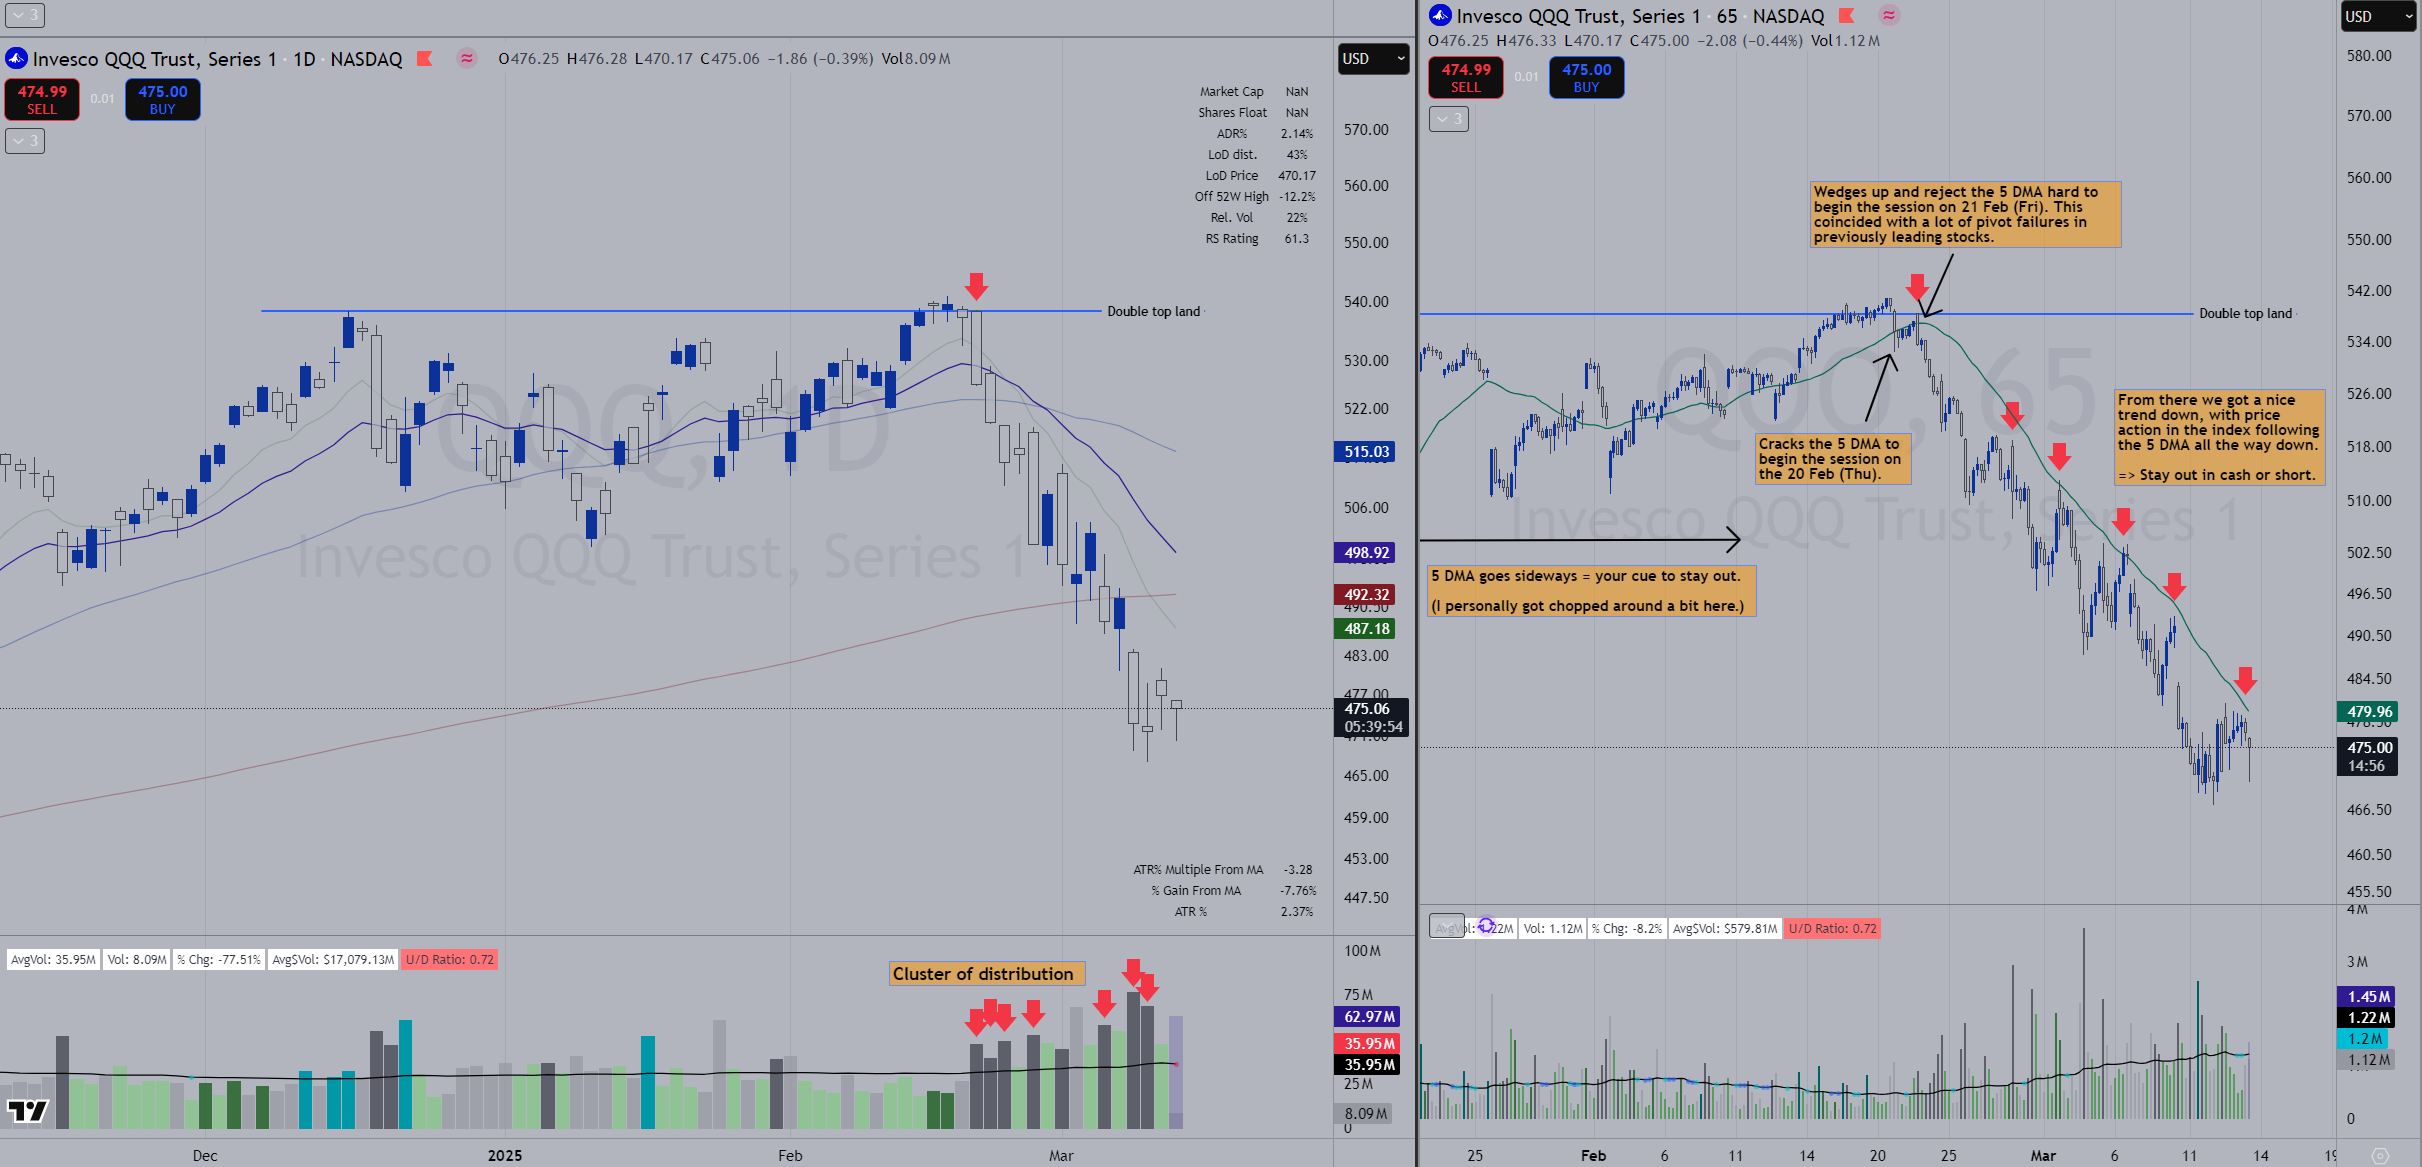
Prior to 20 February, at this stage of the market cycle, notice:
We’ve previously had a good run, where $QQQ trended very nicely since the August 2024 lows.
Since the start of the year, we’ve essentially gone sideways, and seen:
A lack of setups;
Increased volatility; and
Breakouts not following through.
The leading stock of the 2023–2024 market, $NVDA, had started showing ‘wide and loose’ price action, atypical of a market leader.
From the start of 2025, all the way up to 20 February, the 5 DMA had essentially been going sideways. This was your cue to stay out — particularly if you’d only tried to participate ‘here and there’, you’d find yourself getting chopped around.
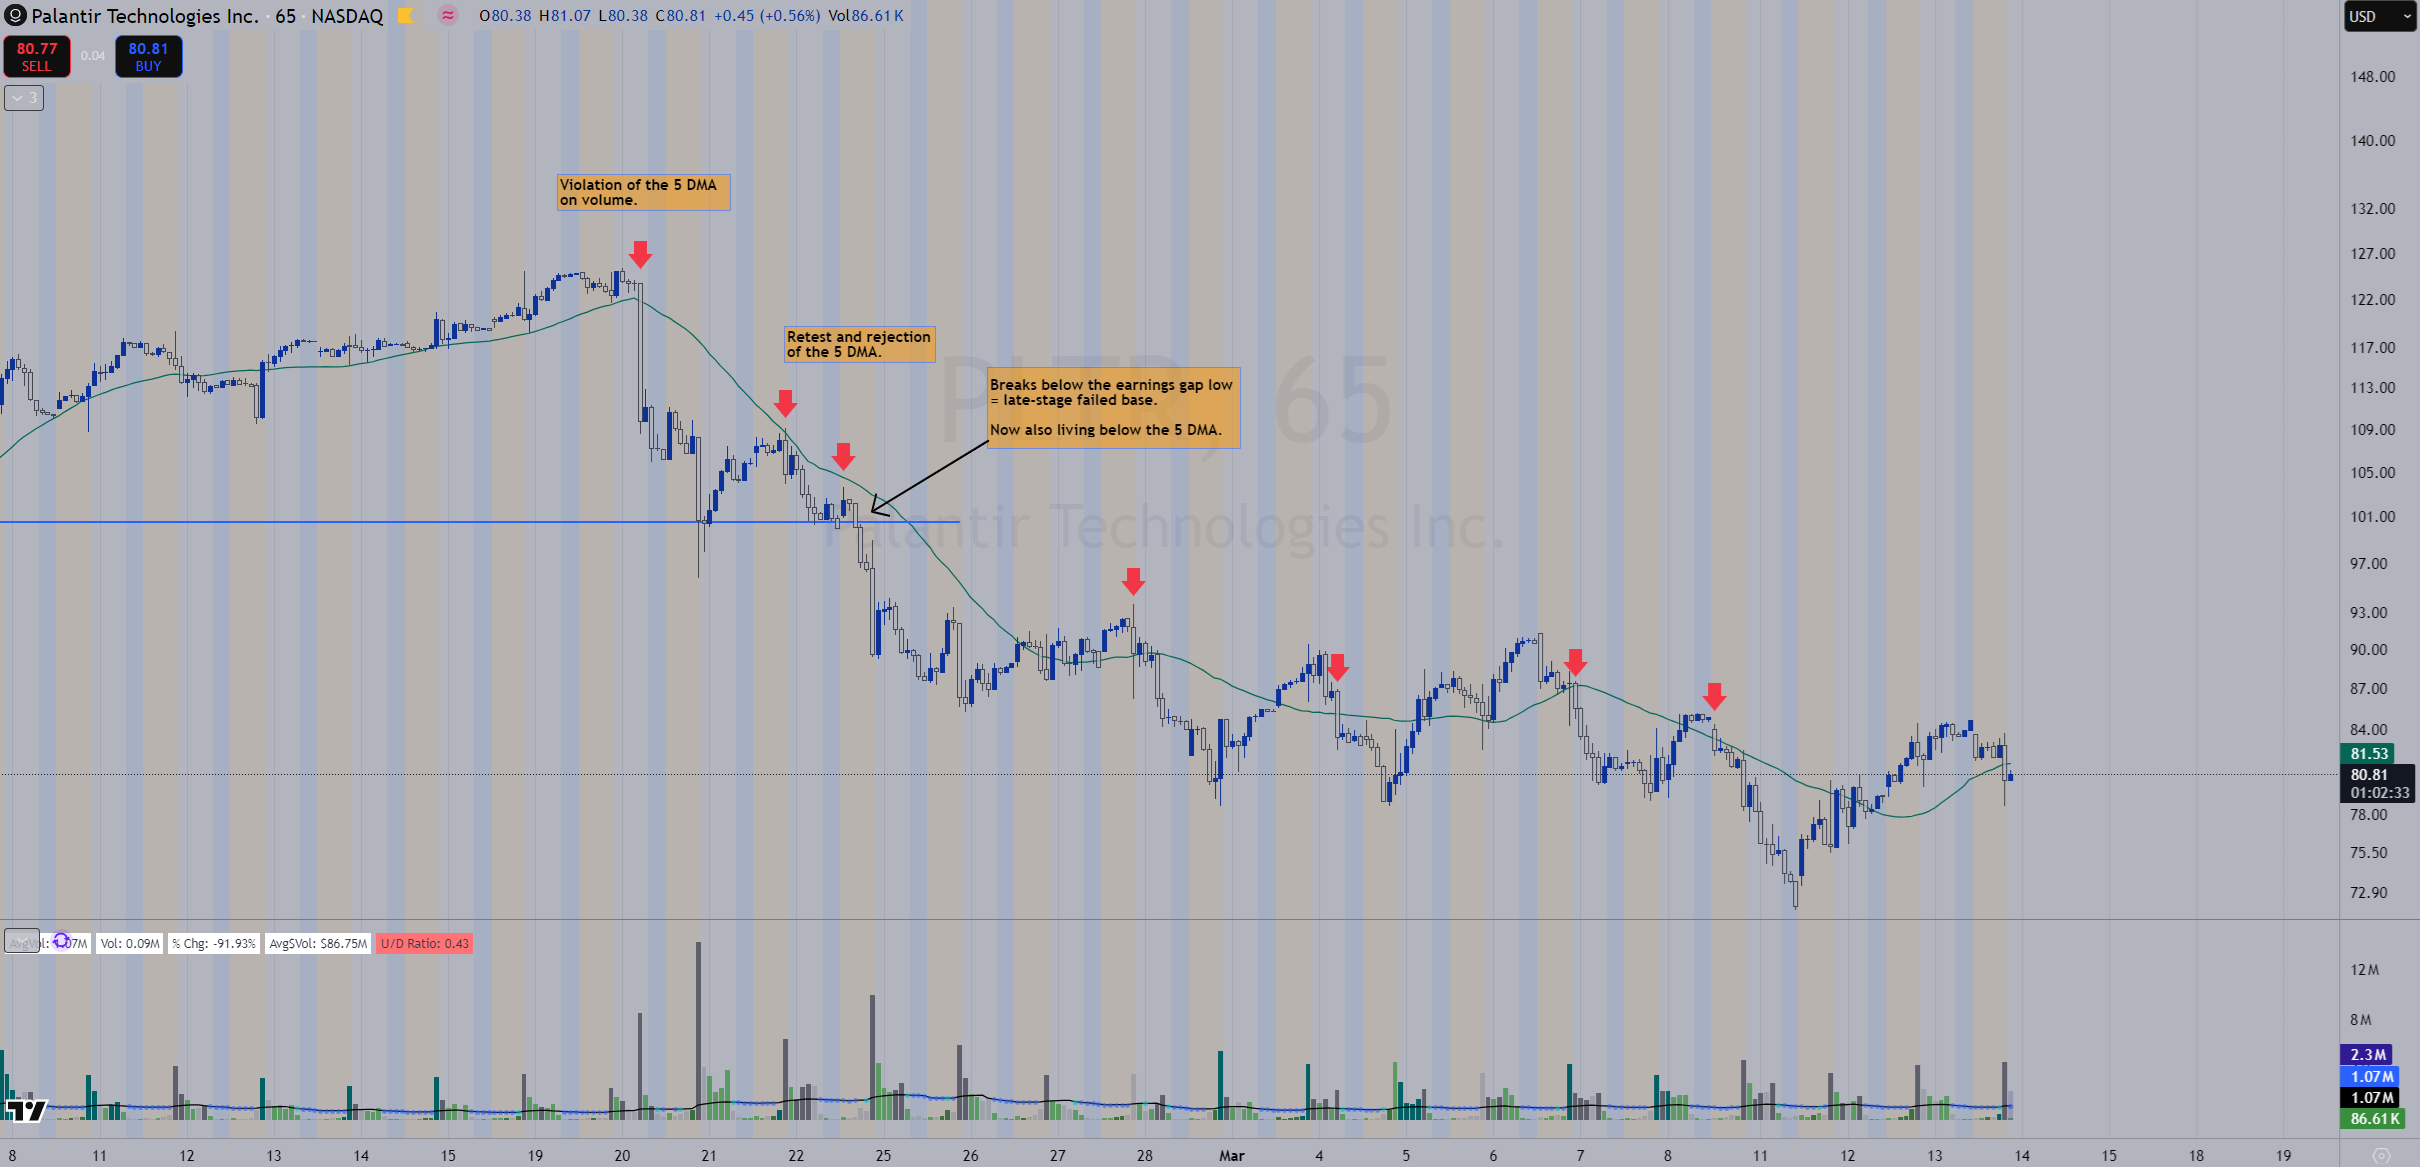
After the 20 February break, the 5 DMA still proved super useful. When you plot the 30-period MA (5 DMA) on a 65-minute chart, you’ll see price repeatedly rejecting that moving average.
Identifying a leading stock getting ready to break down with the 5 DMA: the $PLTR example.
To identify high-probability trades, we want the weight of evidence to be on our side. Again, stack the odds in your favour.
Let’s look at how different types of edges came together with $PLTR:
MARKET EDGE
First, as established, $QQQ broke down on 20 February, when it violated the 5 DMA. It subsequently rejected the 5 DMA on 21 February.
TECHNICAL EDGE
Second, $PLTR gapped up on the latest earnings report and began following through to the upside.
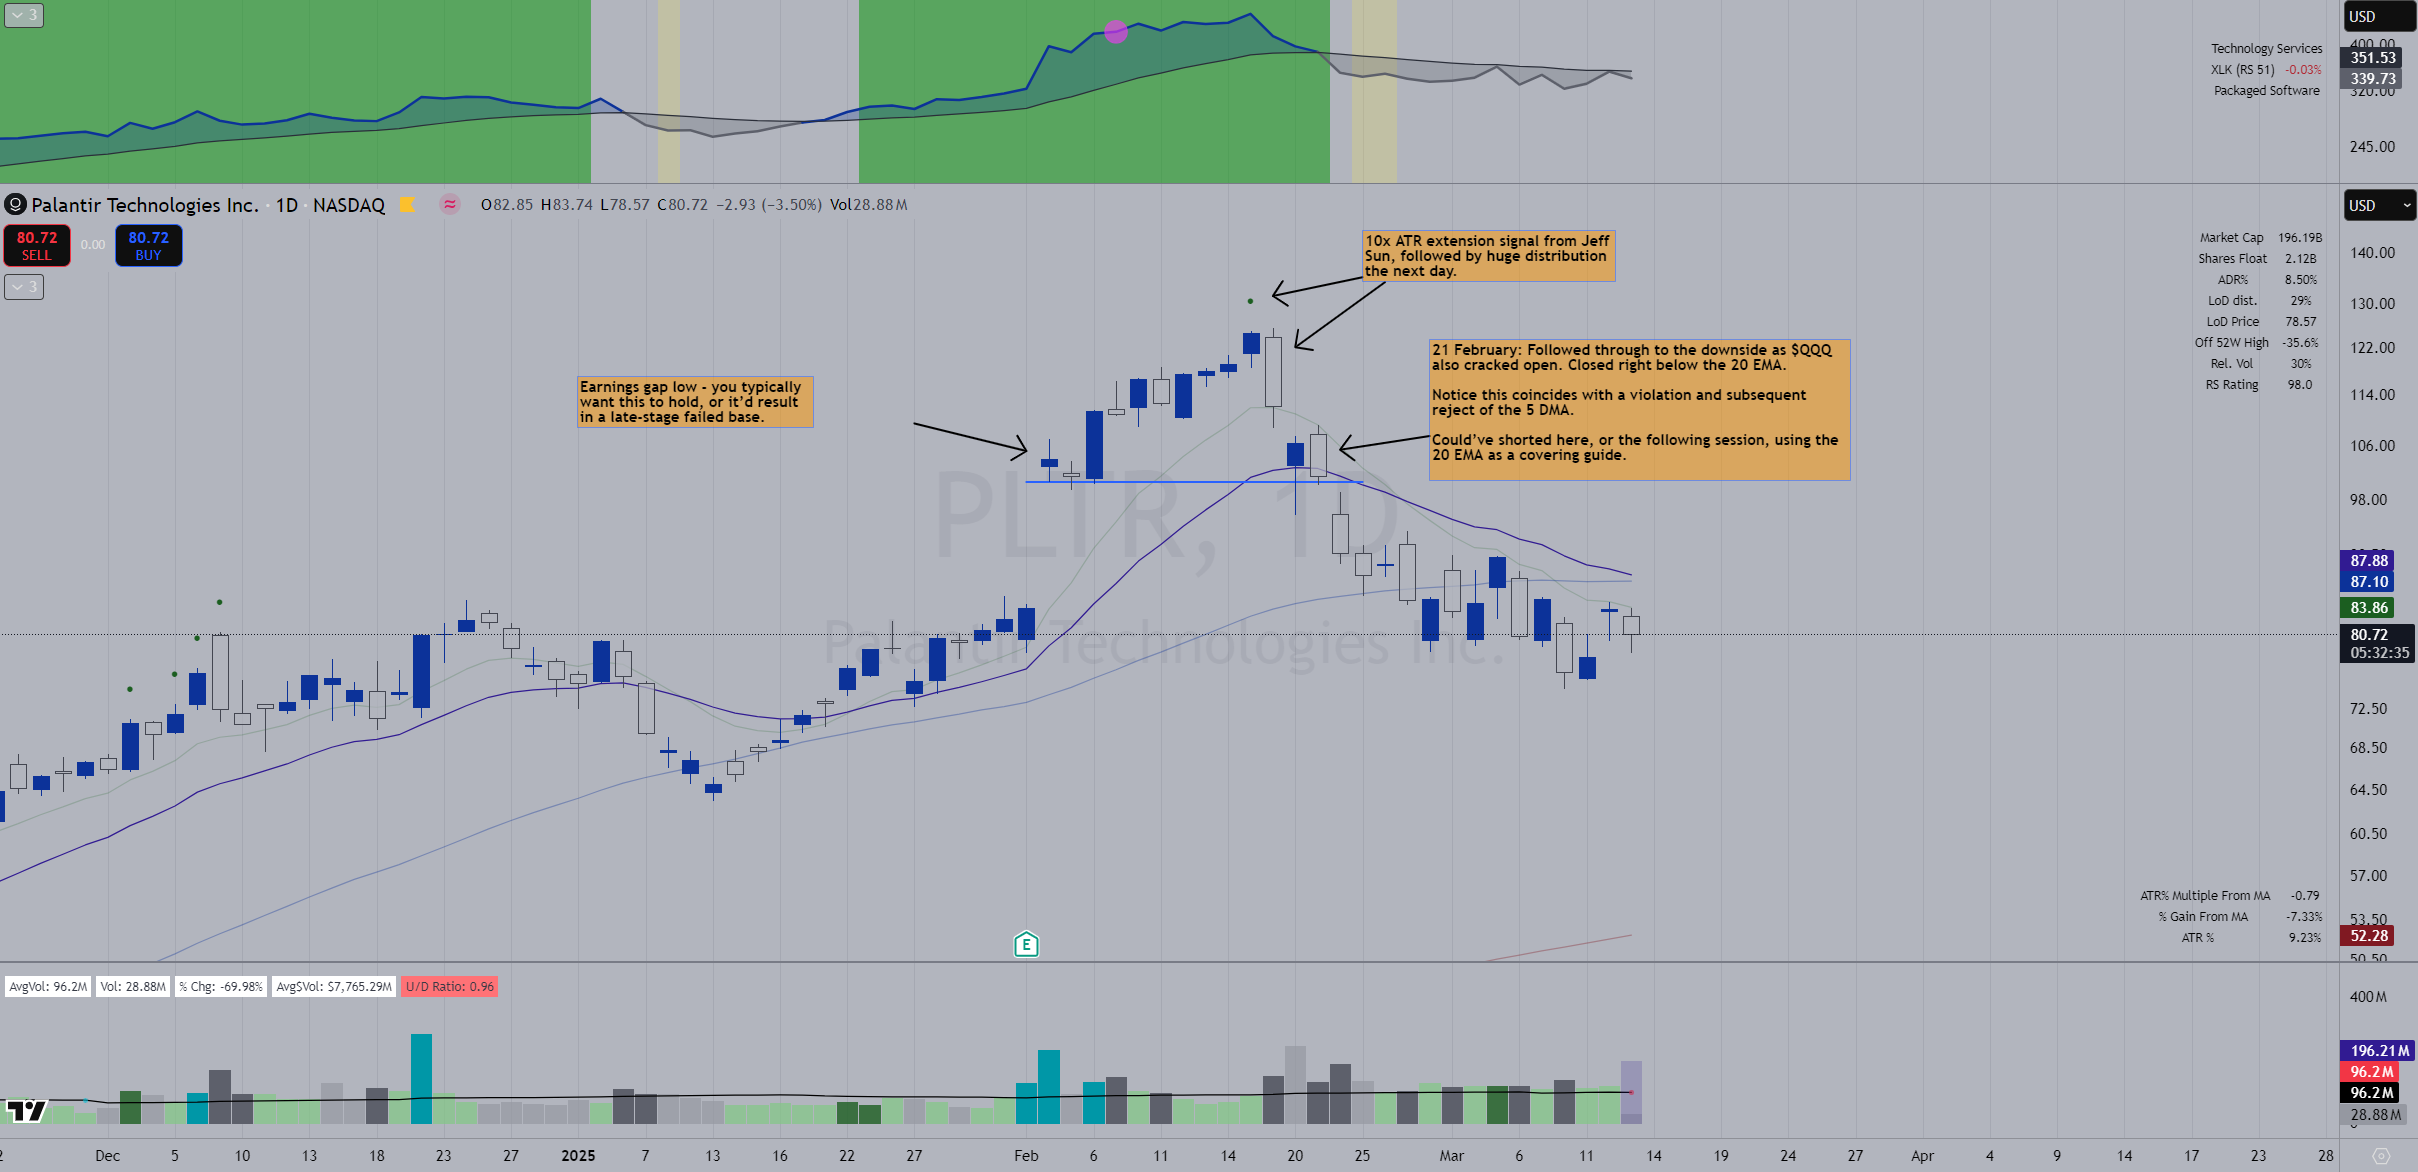
The violation of the earnings gap low implied a lack of post-earnings announcement drift (PEAD), and that institutions have begun distributing the stock.
Paired with a violation of the 20 EMA, that’s a late-stage failed base.
Extra detail: The post-earnings run-up in $PLTR flashed a 10x ATR sell/trim signal (credits to Jeff Sun), which was followed by a large distribution bar the next day.Third, the huge sell-off coincided with a violation of the 5 DMA, and a subsequent retest and rejection of the 5 DMA.
SITUATIONAL AWARENESS (CHART HISTORY) EDGE
Fourth and final, always ask Brian Shannon’s question: “Where have we come from?”
$PLTR was an institutional and retail darling throughout the 2023–2024 bull market. Its price went from the low single-digits to over $100 in two years.
So, who’s left to buy?
In short, using the usual setup rules on the daily charts and supplementing them with the 5 DMA on the 65-minute adds a level of detail and conviction to where the shorter-term trend is moving — especially in this choppier, more volatile market environment.
Using the 5 DMA for the long side: the $HSI example.
The recent strength in the China market is much more tantalising compared to the US market:
Upon consolidating the September 2024 run-up, $HSI (Hong Kong stock market index) essentially went sideways for a couple of months before putting in a double bottom and reclaiming the 10-, 20- and 50-day MAs.
These reclaims coincided with price trading above the 5 DMA, which then flatlined while price went sideways, ready for the next move higher.
As price ran up, notice how price followed the 5 DMA very nicely — until recently, when it starting flatlining and chopping around again.
Given the shorter-term nature of the 5 DMA, it’s naturally more sensitive to recent price changes, making it perfect for shorter-term trading — especially in our current volatile market environment.
Going forward, as the market (hopefully) changes, I want to continue studying the 5 DMA and ways of incorporating it into my trading in different environments.
For now, I can say that incorporating the 5 DMA has been a valuable addition to my trader’s ‘arsenal of edges’ — certainly for choppier environments, helping me stay out when I should, and learning to trade off shorter timeframes when longer holding periods aren’t an option.
PART 4: KYNA ON TODAY’S KEY LESSONS
There’s no one right way to trade.
But MAs are a popular indicator for a reason — in both bullish and bearish environments.
From keeping you in winners, to flashing warning signals, MAs have multiple use cases. But swing traders use them because we tend to concentrate on trends — and, as Clement shared with me:
John W. Henry said (featured in Trend Following by Michael Covel):
“Trends develop because there’s an accumulating consensus on future prices, consequently there’s an evolution to the believed true price value over time.
“Since investors are human and they make mistakes, they’re never 100% sure of their vision and whether or not their view is correct. So price adjustments take time as they fluctuate and a new consensus is formed in the face of changing market conditions and new facts.”
We follow the MAs because the market is dynamic and always changes in the face of new information.
But humans are imperfect, so the information we perceive slowly gets discounted into the price. Since us traders never truly know when a certain market narrative is fully discounted in the price, MAs become a useful tool for us sticking to the trend!
But as with anything in trading, the real power comes from stacking edges in your favour.
Through combining MAs, for instance, and/or by using them together with other indicators.
Brian Shannon may say, for instance, that “the 5-day moving average has saved me more money than anything else, period” — but this doesn’t take away that he does look at other indicators and, most importantly, price action.
Crucially, MAs are objective.
Traders use their discretion about whether they use a simple or exponential moving average, and may differ in the specific numbers they use, but…
…over a large enough sample size, it doesn’t matter whether you use a 20 SMA or a 21 EMA.
What does matter is that you:
Apply your moving average consistently;
Adapt it to your system and timeframe; and
Use it for less emotional, simpler decision-making.
Working across Montreal, UK and Hong Kong time zones wasn’t easy.
But this collaboration allowed us to share different perspectives, and show how the core lessons don’t lie in copying someone else’s indicators verbatim, but in their use cases — understand the ‘why’!
Then, adapt them to fit your needs to build (or strengthen) your conviction.
Francesco and Clement, thank you very much for your contributions!
P.S. If you aren’t already, please follow @FranVezz and @Clement_Ang17 on 𝕏.
Support my work
If you find value in The Trading Resource Hub, and would like to support future work, please buy me a coffee:
Or if you’re new here, you can explore my archive first.


Great info as always! thanks!
Very nicely written. Thanks Kyna!
After the psychological articles, this technical one fits perfectly into the mix. I have some takeaways from this one and will definitely incorporate MAs into my profit taking methodology.