What Are The Odds of a Losing Streak?
Risk management and the psychological benefit of understanding statistics
I recently posted a stack on my promised quantitative analysis techniques for Excel-based trading journals, inspired by a Tom Dante video, which I hope you found useful.
Today, I thought I’d follow up on a different part of that video, starting at 33:07, where Tom talks about the probabilities of losing streaks. Essentially, what are the odds of getting a certain number of losers in a row, over a certain number of trades and given a certain strike rate (batting average)?
Why you need to manage your risk
When I first came across the concept of calculating the odds of consecutive losers, I was really quite intrigued, and could see the link to risk management.
At the time, I was already well aware of how important it is to take prudent risk to keep the downside in check. Qullamaggie’s website says this too: specifically, Kristjan rarely risks more than 1% of his account per trade now, and even when his account was smaller, he wouldn’t really exceed 1.5% risk per trade.
Why is that? Well, losses work geometrically against you:
If you’re down 10%, you need 11.1% to get back to breakeven.
If you’re down 20%, you need 25% to get back to breakeven.
If you’re down 50%, you need 100% to get back to breakeven. You need to double your account, just to break even!
So you don’t just want to limit the % loss on any single trade, but also make sure it isn’t (too) hard to come back from a string of losers by limiting the account % risk on each trade.
But this wasn’t news to me, and I hope it isn’t to you either. So what was new — to me, at least?
Calculating loser streak probabilities
The ‘scoop’ for me was that, when the strike rate is known, the probabilities of loser streaks can be calculated. Nobody likes a string of losers, but they happen. The question is: how often? What are the odds?
To answer such questions, I figured I’d build a calculator in Excel that allows me to play around with different strike rates to see how this affects the odds of having 2–10 consecutive losers within different numbers of trades.
Let’s explain that with a few examples.
50% strike rate
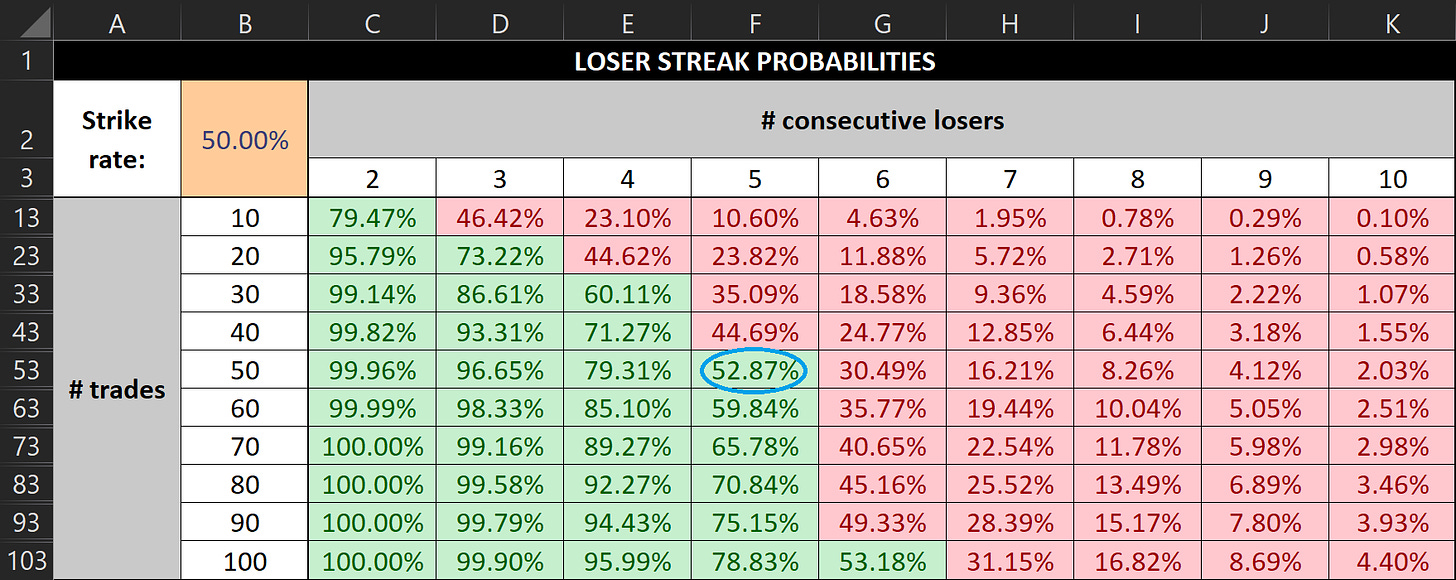
Suppose that half my trades turn into winners — i.e. my strike rate is 50%. And suppose that I make 50 trades every month. (These numbers were picked randomly for illustration purposes only.) What does my calculator say?
Well, it’s telling me that, every month, I have more than a 1 in 2 chance of getting 5 losers in a row. And as you’d expect, those odds get worse if you place more trades, and improve if you place fewer trades.
40% strike rate
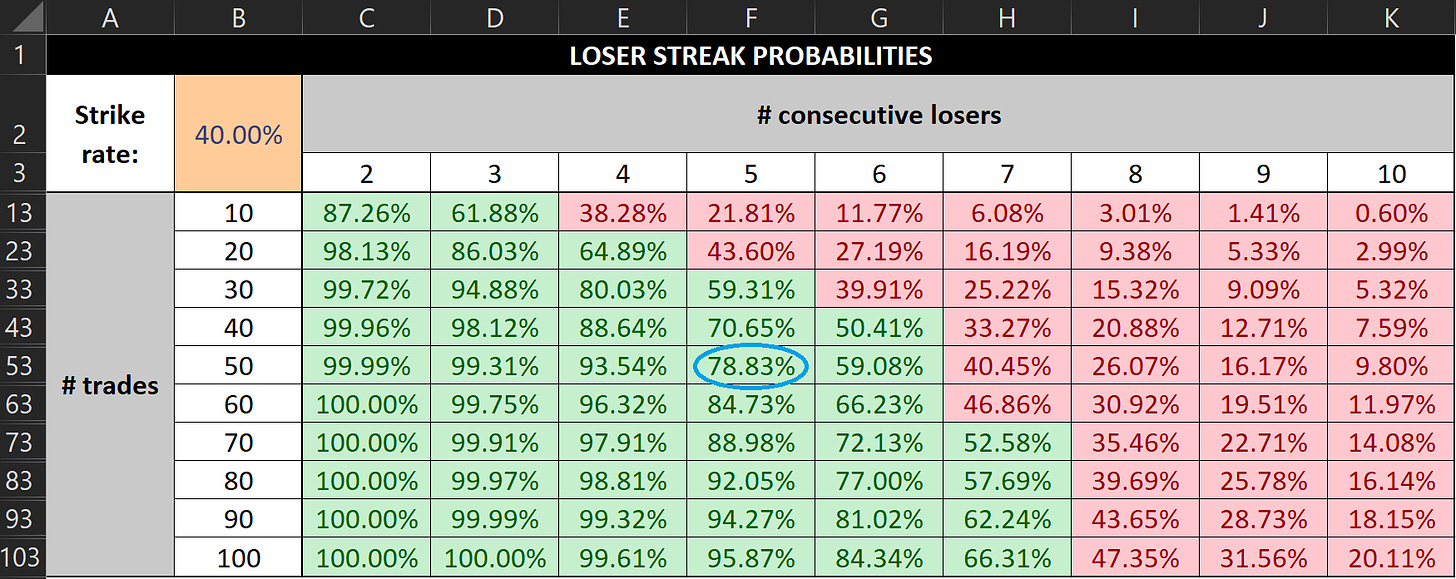
What about if my strike rate was lower — say 40%?
Sticking with the 50 trades variable, every month, I’d have a 78.83% chance of getting 5 losers in a row. Even the odds of getting 10 losers in a row are not that low — nearly 10%.
Zooming out, what’s the point of this?
Well, it’s telling me that, from a purely mathematical perspective, the odds of suffering a 10% account drawdown are far higher than I’d like. It is probable, and not merely possible, that this will happen over the course of an entire trading career. And when it does happen, I can’t be losing, say, 5% of my account per trade — not if at some point that’d mean I’m 50% down, and need to double my account just to get back to breakeven!
(Even if I adjusted my risk after every trade, I’d still be down 40%, and would need a 67% gain just to get back to breakeven.)
Applying Qullamaggie’s strike rate
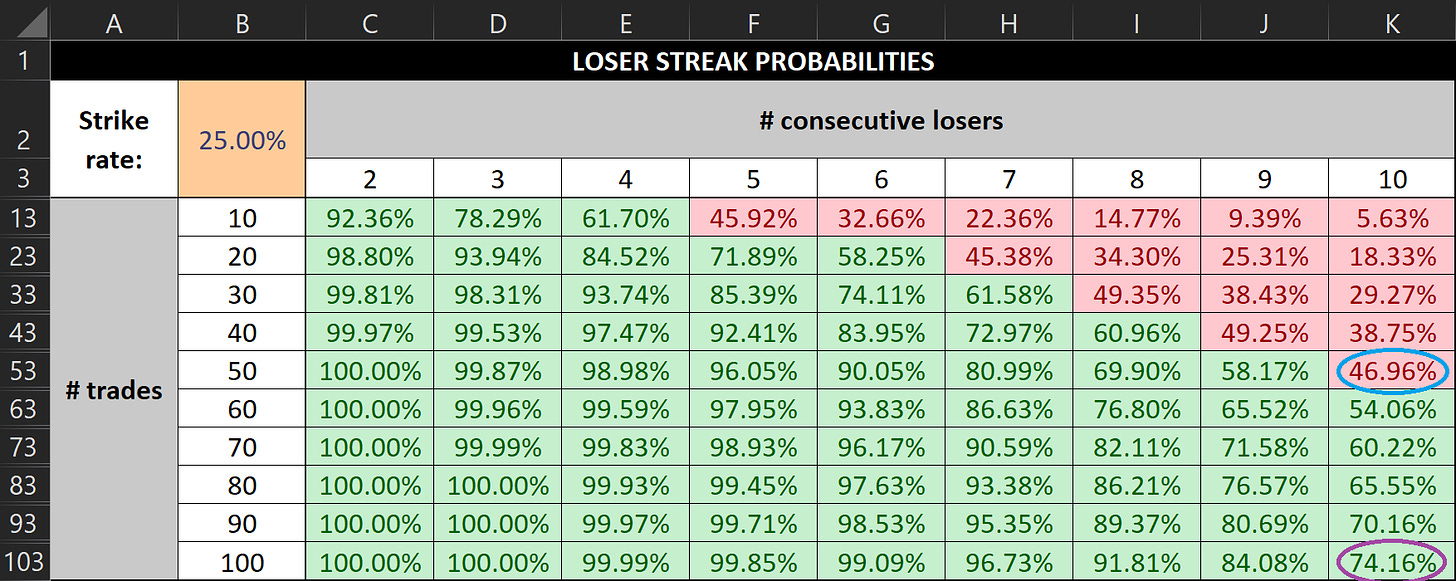
Just as one final example, what if we took Kristjan’s strike rate from 2019 (which he posted on his FAQ, under “What’s my winrate?”) and fed it into my calculator?
Well, with Kristjan’s 25% strike rate, the odds of getting 10 losers in a row over 50 trades increase to 46.96% (circled in blue). And if we doubled that — i.e. if we looked at the odds across 100 trades — the chances of getting 10 consecutive losers jumps to 74.16% (circled in purple).
Taking market conditions into account
Of course, the reality of trading is more nuanced. Most of us here don’t trade mechanical strategies, but trade setups whose success rates hugely depend on the market environment. With that in mind, the wisdom shared by great traders about listening to what the market is telling you, not doubling down after a string of losers, not getting aggressive when your trades aren’t working, and so on — that’s all good advice, and takes priority over any sort of theoretical probabilities.
Furthermore, because many strategies work better in certain conditions than others means that you don’t just get losing streaks, but winning ones too, regardless of the maths involved. And when you’re onto a winning streak, increasing your exposure is usually a very good idea.
In short, situational awareness and adapting to the environment are essential skills, and much more important than understanding the maths involved.
The psychological benefit of understanding the statistics
As humans, it can be mentally tough to sit through losing streaks, even if you’re aware of the impact of market conditions. That’s why I personally found it very helpful — calming, even — to understand the maths of consecutive losers.
Like Qullamaggie and many of his students, I trade a strategy where I’m more often wrong than right. Understanding that losing streaks are mathematically completely unsurprising helped me make peace with that.
More content like this
If you haven’t already seen it, do take a look at my post detailing my quantitative analysis techniques based on what I learned from Tom Dante.
All my quantitative-analysis-related posts are available here. If you’re more interested in my Qullamaggie notes, they’re all available here.






Could you advise how to mathematically calculate the above % of losing streaks?