How to Calculate Losing Streaks
A reader request from "What Are The Odds of a Losing Streak?"
On my post What Are The Odds of a Losing Streak?, a reader requested I elaborated on how to actually calculate such losing streaks for yourself.
It’s time to fulfil that request!
Why bother calculating losing streak odds?
When I first realised — thanks to a Tom Dante video — the value of calculating the odds of a losing streak within a certain number of trades and given a particular strike rate, I set about building a calculator for precisely this purpose.
My reasoning was that if I could quantify (at least from mathematical point of view) the odds of a certain number of losers in a row, I could keep things in better perspective. I shared a concrete example of this here.
Another way this calculator can help you psychologically — specifically, to keep a cool head by maintaining perspective and understanding the reality of your maths — is by knowing the odds of your own losing streaks, based on your typical number of trades within a given period and your own strike rate.
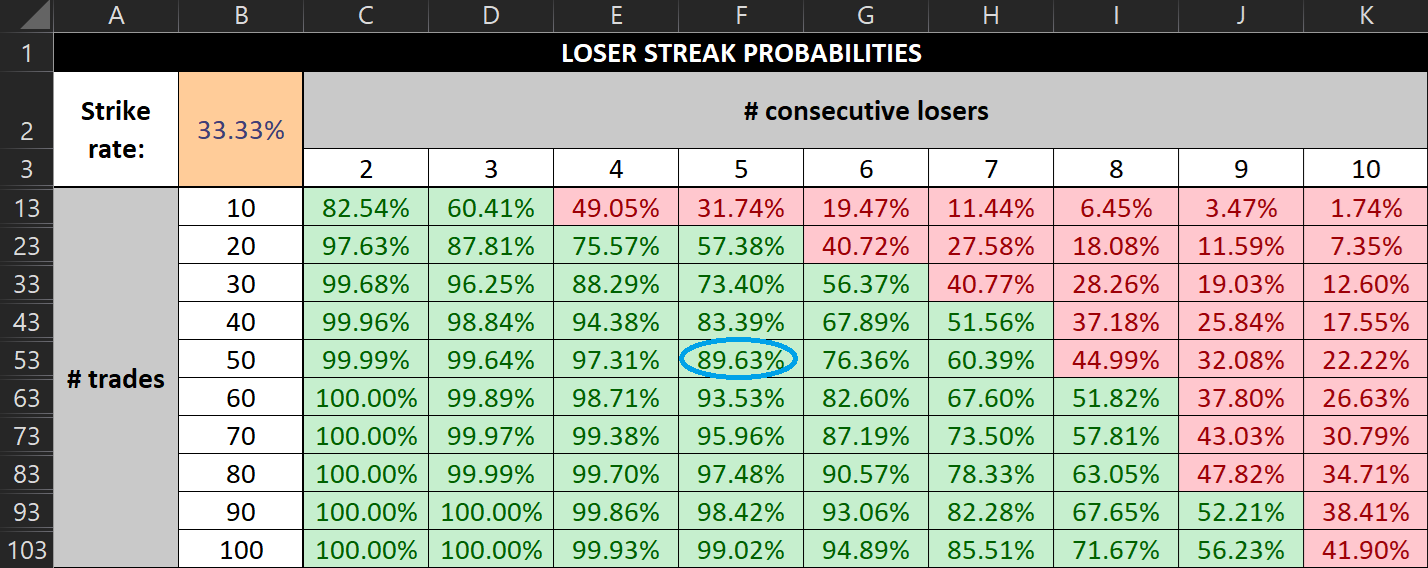
If you have a strike rate of 1 in 3, for example, and place 50 trades a quarter, the odds of getting 5 losers in a row in any given quarter are nearly 90% — pretty high. Keeping that figure in the back of your head can help avoid panic.
An important caveat
Market conditions play a role in most strategies, which my calculator doesn’t (and probably cannot) take into account. As such, it’s important to bear in mind that both winning and losing streaks are to be expected, irrespective of what the theoretical probabilities are.
So, if you’re suffering multiple losses in a row, don’t panic — but also take this as a sign that the market may not be conducive to what you’re doing, and decrease your exposure. Take more prudent risk.
And when you’re on a winning streak? Do the opposite. Increase your exposure, trade more aggressively, and take advantage of the good market (for your style) while it lasts.
Incidentally, this advice doesn’t come from me, but from the likes of Qullamaggie, William O’Neil, Mark Minervini, David Ryan, Stockbee, Oliver Kell, Leif Soreide, and many others with significant — and proven — track records.
Further reading: You can learn more about progressive exposure here.
Building the calculator in Excel
Before we start, I should make clear that my Excel skills are only ‘good enough’.
When I started my quantitative analysis journey, I essentially developed my Excel skills as I went along. Starting from knowing almost nothing about Excel, I simply experimented and/or looked up stuff whenever I was figuring out how to calculate the answer to some hypothesis or question I had.
In that process, I’ve never resorted to macros, because I’ve always been able to get the answers I wanted without them. I also built Excel-based tools in my day job, but the same thing applies there: there’s no need for macros, so I don’t use them. (For context, those tools require more writing than Excel skills.)
For the purposes of this calculator, I’m sure that someone with more advanced Excel skills could turn it into something fancier. But what I developed for myself works for me.
My limited Excel abilities may also have a big advantage for a few of you: if you want to try out my calculator or other Excel-based techniques, you won’t have to face any steep technical learning curves.
Step 1: Set up your axes
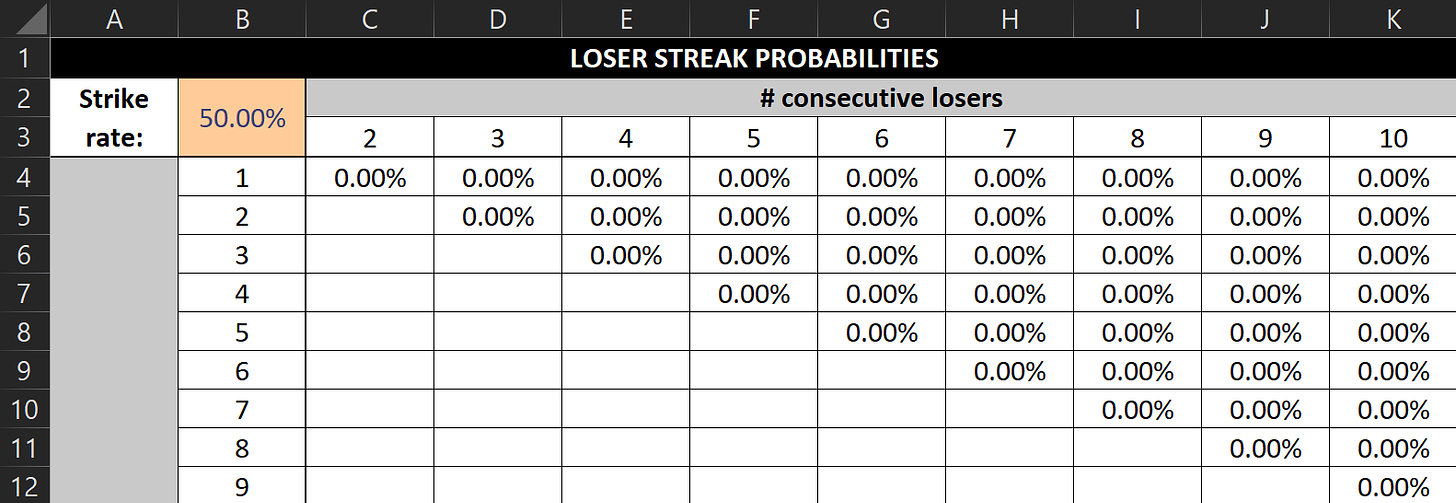
The below is how I set up my axes.
X-axis:
Obviously, you can change these numbers to suit your needs and preferences. For example, you could start at a higher number than 2 or carry on beyond 10.
Cell B2 (the strike rate) should be formatted as a percentage, with as few or many decimals as you like. When you are actually using the tool — as in, playing around with the numbers — the strike rate is the only thing you should be changing.
Y-axis:
Note that you do need to complete this series without skipping any numbers for the formulas to work (use the ‘Fill Series’ function in Excel to speed this up). I go up to 100 — you can go as high or low as you like.
Later, when you’re finalising your calculator, you’ll hide most of these rows to maintain oversight.
Obviously, feel free to design the tool as you please.
Step 2: Start filling out the calculator with 0s
Format the cells that will be returning your probabilities as percentages (using as many or few decimals as you like), and complete the following with a series of 0s:
Essentially, wherever the number on the X-axis exceeds the number on the Y-axis, enter a 0 (because you can’t get 2 consecutive losers in 1 trade, etc.). Use copy and paste to your advantage.
Step 3: Complete the first column
For cell C7 (see the screenshot above), this is the formula:
=C6+(1-$B$2)^C$3*$B$2*(1-C5)
Copy and paste this into cell C7, then copy and paste that cell over the blank cells, apart from: the cells with n losers in n trades.
Those cells (C5, D6, E7, etc.) need a different formula:
=(1-$B$2)^C$3
Use the above formula for C5, then copy it to the remaining cells that look at n losers in n trades.
Step 4: Add conditional formatting (optional)
I personally find it helpful to colour the losing streak probabilities >50% green, and the probabilities <50% red. If you want your calculator to do this too, use conditional formatting:
Step 5: Hide the rows you don’t need
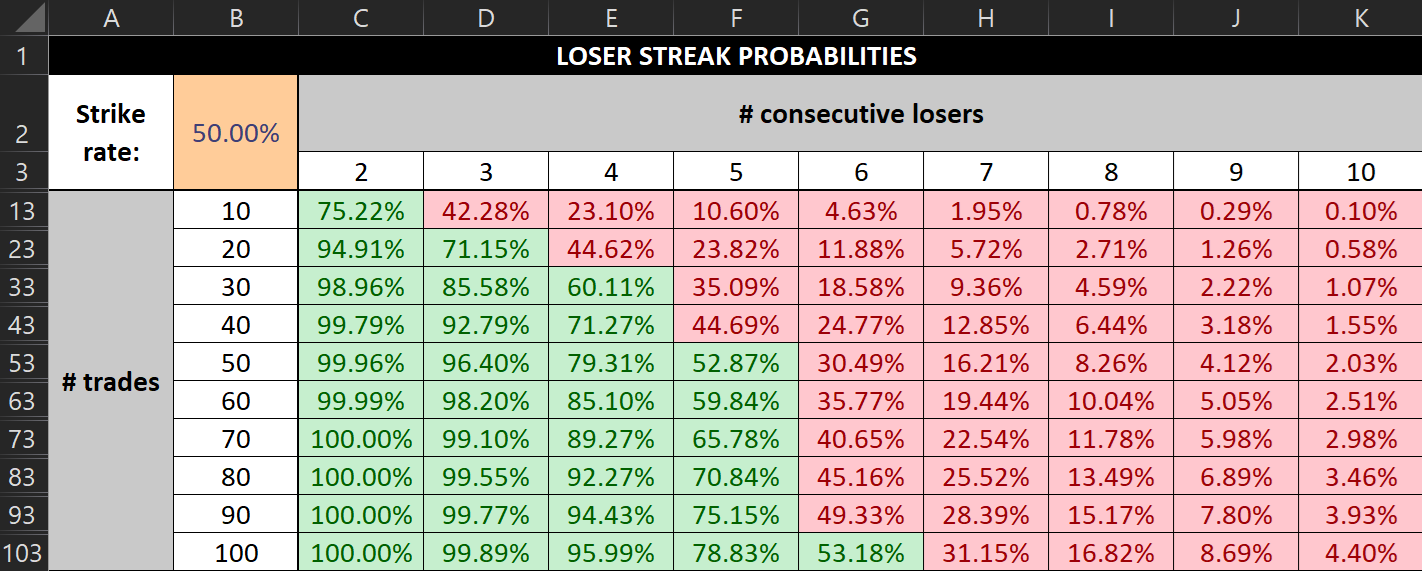
This is how my finished calculator looks:
So rows 4–12, 14–22, 24–32, etc. are hidden to maintain oversight of the calculator. Naturally, you’re free to hide whatever rows you don’t want to look at.
Step 6: Prevent accidental changes (optional)
This final step is an optional one. All cells should be locked by default — this means that if you protect your sheet (whether with a password or not), you can’t make changes to them, accidentally or otherwise.
But as I mentioned earlier: when actually using the calculator, the only cell you want to be making changes to is B2 (the strike rate). So click on that cell, then go to ‘Font Settings’ (Ctrl + Shift + F):
Go to the ‘Protection’ tab, untick ‘Locked’, then click ‘OK’.
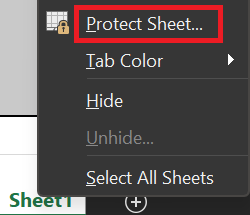
Next, right-click the tab your calculator is on (‘Sheet1’ by default) and click ‘Protect Sheet…’:
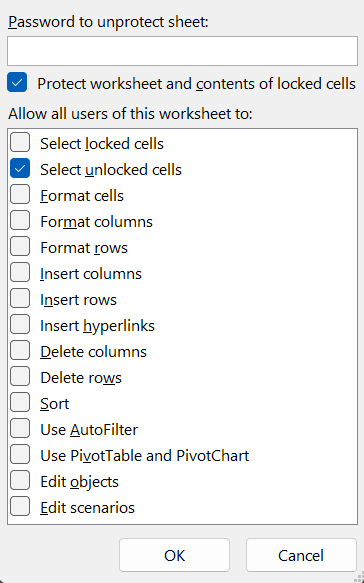
Tick only ‘Protect worksheet and contents of locked cells’ and ‘Select unlocked cells’, then click ‘OK’:
Now, you should only be able to select and change your strike rate. Again, this step is completely optional, but worth doing if you’re worried about accidentally making changes to any formulas.
Final thoughts
That’s it! I hope that’s all clear to you. If not, please leave a comment, and I’ll try to clarify things.
I also wanted to take a few moments to explain why I chose to write out the above, rather than simply share the calculator, when I haven’t held anything back.
I’m keen to give back to the community and help people where I can, but also want to encourage a ‘do it yourself’ mindset.
This is more than just a better way to learn — it empowers you to tailor the tools you need to suit your own needs. This is a great mindset to have as a trader, whether we’re talking tools or strategies.
For those among you currently not very comfortable with Excel, this also gives you a chance to better get to grips with it. As I said earlier, I’m no Excel wizard, but can get it to give me the answers I seek, and even build what I needed to in my day job.
This shows it’s a very learnable skill!
Most of what I know today, I learnt in a matter of weeks after first coming across Tom Dante’s video, because I was so determined to get the hard numbers of my own trading so I could find my edge. And I did!
Support my work
If you find my writing valuable, and would like to support future work, please buy me a coffee:
Or if you’re new here, you can explore my archive first.








Hey there,
I was super interested about your post and wanted to recreate it. While doing so there might be an error (or I might not be understanding). For step 3, using this formula =(1-$B$2)^C$3 for C5 and then using the longer one for the 1st column makes sense but wouldn't you need to do the same thing for each of the columns. So for example for 4 trades, with 4 consecutive losses it would be (1-WR)^4. Because I am not getting the same numbers as you.
Thanks :)
Wasn’t expecting such wonderful reply! Much appreciated on sharing this 💎