Lessons From Dr. Mansi: How to Enter Stocks
Setups, possible morning scenarios, relative volume and stop losses
I’ve mentioned a few times that I wanted to publish notes on Dr. Mansi’s excellent YouTube videos — in particular, the series on how she trades — so let’s get on with it!
This stack focuses on the first video of the series — “How I enter stocks” — and covers:
What I felt were the key points in the video;
What I learned from it; and
Some personal tips and insights I hope will be useful to you.
As ever, I welcome all feedback, so please do let me know what you think! I’m always looking to self-improve, both as a trader and as a writer :)
(In case you don’t know Dr. Mansi (@drmansipd on X/Twitter), she is a very transparent full-time trader who publicly journals her trades, winners as well as losers, and trades similarly to myself. She also has a gift for explaining things exceptionally clearly.)
How to learn from these types of videos
Just so we’re clear, I’m not saying that you should copy Dr. Mansi or, for that matter, any other trader. But watching these types of videos by honest, transparent traders that lay out their systems and processes in a lot of detail — which, by the way, are real gems that are extremely difficult to find — are great ways of learning.
At a high level, I believe these videos teach any trader two big things:
The types of factors your own system has to consider or account for.
The general mindset and thinking of an obviously disciplined trader.
Her videos also go into all sorts of useful detail for breakout traders in particular, which my notes try to account for without becoming too disorganised.
Also, a friendly reminder that these notes are for educational purposes only! Putting them together certainly helps my studies, and I hope they are a useful aid in yours too, but they are no substitute for watching the full video for yourself.
All my direct notes — ‘straight’ notes on top trader resources, including the Qullamaggie streams — are available here. All Dr. Mansi-related notes will, in due course, be available here.
If you like my writing, please do subscribe to get all new posts directly to your inbox. It’s free!
Let’s get started with the video notes. Timestamps are included — as I’ve previously said: you speak, I listen!
Setups
Dr. Mansi mostly trades two types of setups: breakouts and pullbacks (0:58). Both of these are very common setups with good strike rates.
Breakouts
Breakouts are a “super simple but very effective setup”, to quote Dr. Mansi. Here’s a step by step:
Look for stocks showing momentum:
The stock has gone up for 3–5 days.
Big volume is coming into the stock.
Ideally, the stock also has recently had a positive catalyst (e.g. surprise earnings — also see EPs).
Wait for the stock to consolidate (i.e. for the price to move sideways) on lower volume.
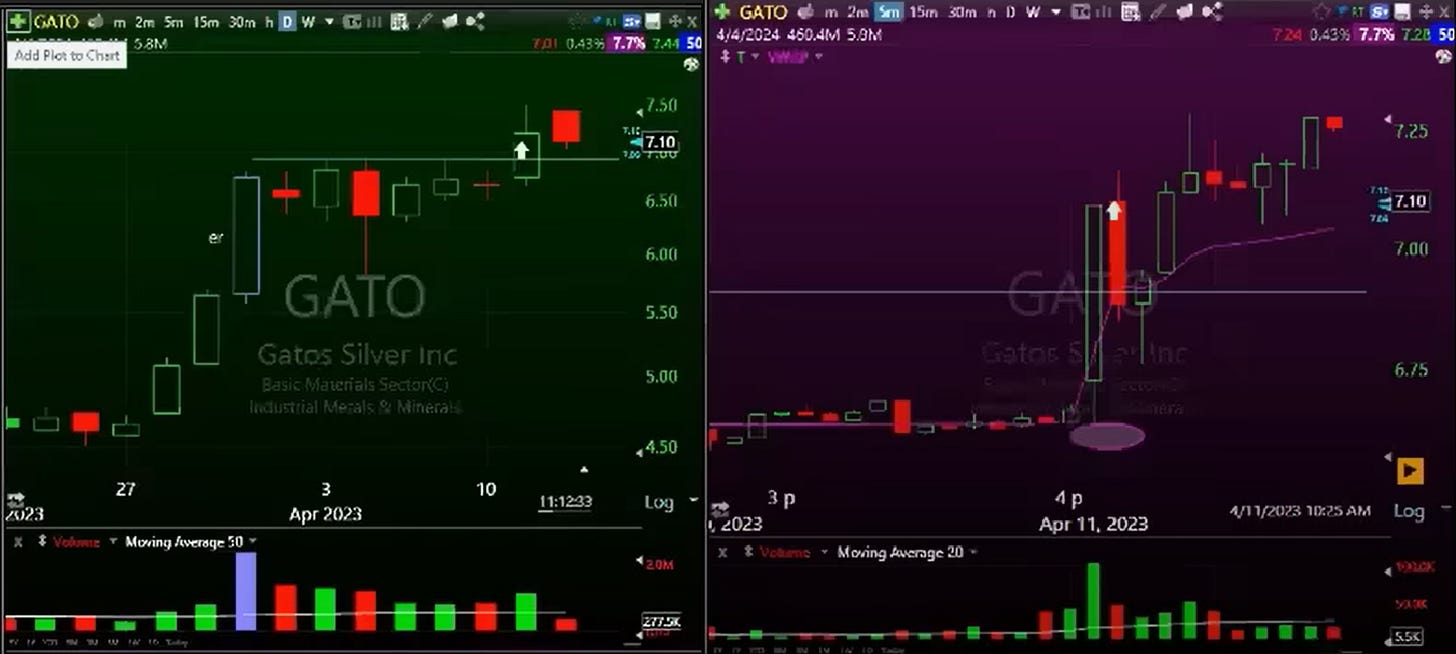
Draw a resistance/pivot line (such as the line just below $7 in the screenshot below) and set an alert.
As the stock breaks through that line (ideally on high volume — more on that later), you enter it.
Example: Breakout on the $GATO daily chart on 11 April 2023 (I added a blue arrow in the screenshot below), as per Dr. Mansi’s tweet. That tweet also gives her other entry details, including the trade type and stop loss placement. In her replies to that tweet, Dr. Mansi outlines the trade outcome.
Pullbacks
Dr. Mansi describes this as “a variation of the breakout setup” that she actually prefers, due to the better risk-to-reward ratio (2:21).
Here’s the step by step:
Find stocks with momentum (up for 2–3 days on high volume).
See if the stock pulls back slowly, on low volume, typically towards the 10 or 20 MA.
Find a short-term resistance area (in the example below, it’s the high of the two days preceding the buy point).
Draw a resistance/pivot line and set an alert.
As the stock breaks through the pivot line (again, preferably on volume), you enter it.
Example: The daily $BMEA chart on 11 April 2023 (see the blue arrow I added), as per Dr. Mansi’s tweet. Again, her tweet and her replies to it explain the trade in more detail, including how she exited it.
Planning your entry (and how I failed to do this when I started)
After identifying potential breakout or pullback candidates, and identifying the resistance lines they must break through before you enter them, you need to plan your precise entry tactics, considering the different possible scenarios you may face in the morning.
I’ll be honest: this is something I failed to consider for quite a long time. In the early days, every night, I’d diligently go through my scans and make a watchlist for the next day, set alerts, then rush to place orders when the alerts went off. The fact that, at the time, I was still trading the UK markets — so my working hours significantly overlapped with market hours — really didn’t help matters. (And for the record: I am now much better prepared, with much clearer rules! Plus, I can now 100% concentrate on the (US) markets at the critical times to execute my strategy.)
I also know I’m not the only one who started out this way, in part because a lot of trading books (that I’ve read, anyway) only talk about chart patterns and where the buy points are. Not about the practicalities of execution on a day-to-day basis, depending on the different ways the stock might move through the entry point. So if you come across Dr. Mansi’s videos early in your trading journey, consider yourself lucky. Seriously.
So, what does Dr. Mansi say? From 4:11, she explains that her entries are decided by 9:35 EST, as her entry tactics are based on how the stock opens and acts during those first 5 minutes of the market open.
Three possible scenarios
1. The stock gaps up
The first possible scenario is that the stock gaps up, in which case Dr. Mansi says she enters on the 5-minute opening range high (ORH).
The point of waiting for the first five minutes is to allow the stock to set a range, giving you clear entry and exit points: enter when the stock takes out the ORH, and set the stop loss at the low of the day (LOD).
Incidentally, when you have a gap up, it’s worth checking whether there’s news on the stock (discussed further later). If there is, the news is obviously positive, which improves your odds of the breakout working.
2. The stock crosses the pivot line within the first 5 minutes of the open
The second scenario (6:11) is that the stock doesn’t gap up, but does cross the pivot line within the first 5 minutes of the market open. In this scenario, Dr. Mansi takes the same approach as with the first scenario: waiting for the first 5-minute candle to form, then entering as the ORH are taken out, with a stop loss at the LOD.
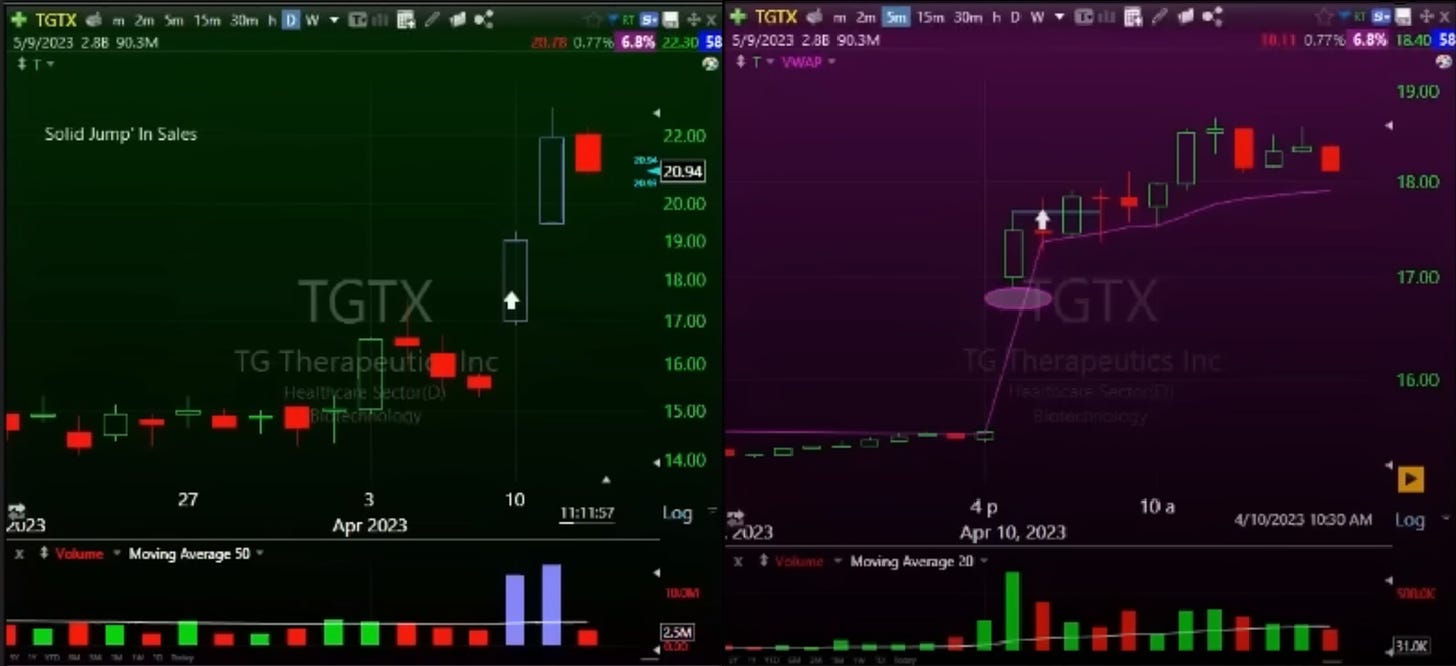
Why does Dr. Mansi wait until at least 9:35 EST to enter a trade? Because she doesn’t like to enter within the first 5 minutes due to high volatility then — that is usually the time retail traders are most active, meaning that there can be an early buying frenzy, followed by the stock just fading for the rest of the day if institutions don’t follow through on that buying. As such, she likes to give the stock 5 minutes to settle down and make a range, and then enter at the 5-minute ORH.
She does sometimes make an exception (by entering on the 1-minute ORH), but only if:
We’re in a raging bull market;
There’s a really strong catalyst on that stock; or
The market as a whole has a really strong catalyst.
(This matches my own experiences too, and I’ve heard others say similar things.)
With that in mind, the third scenario (8:33) is the one Dr. Mansi prefers:
3. The stock crosses the pivot line after the first 5 minutes
In this scenario, you enter when the stock crosses your pivot line and set the stop at the LOD again. From Dr. Mansi’s point of view, this scenario is best, not just because you avoid the typical early-morning volatility, but also because you get to buy exactly where you want, plus you get time to plan your entry.

Relative volume
From 10:53, Dr. Mansi talks about the significance of relative volume for determining the likelihood of a trade working (within her strategy) and, by extension, deciding whether or not she’ll take the trade.
To quote Dr. Mansi herself (17:34):
“Volume actually confirms the price. So it tells you whether the price movement is likely to stick or not.”
However, when you’re buying a stock, you don’t know what the volume of the day will be — but the ‘Vol Buzz’ data column in TC2000 (or the equivalent data from other trading platforms) does give you a pretty good indication. Plus, the later in the day it is, the more accurate the volume read will be.
Let’s look at four examples of incorporating relative volume into your decision-making process on whether or not to take a trade.
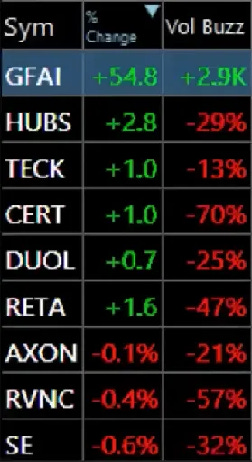
Example 1
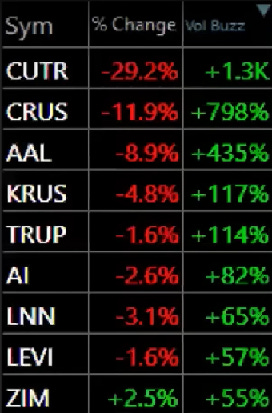
If your watchlist for the day looks like the screenshot below, what does this tell you?
Most stocks (that you’re watching) are down on the day. As such, the odds of a breakout working are low, and you should probably not take the trade.
Furthermore, the stocks are down on heavy volume. So, to use Dr. Mansi’s phrase again, “the [downwards] price movement is likely to stick” — which only decreases the likelihood of any breakout working.
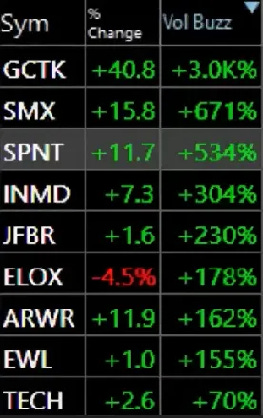
Example 2
If your watchlist for the day looks like the screenshot below, what does this tell you?
Most stocks (that you’re watching) are up on the day, so the odds of a breakout working are pretty decent.
Furthermore, the stocks are up on high volume, indicating that serious buying is going on. So, to use Dr. Mansi’s phrase again, “the price movement is likely to stick”, and breakouts stand a good chance of working and getting some decent follow-through.
In short, this is the ideal environment for buying breakouts.
Example 3
If your watchlist for the day looks like the screenshot below, what does this tell you?
This is a mixed day, with a few stocks up, and a few stocks down.
Looking closer at the numbers, the stocks that are green aren’t up very much in % terms.
More importantly, the volume is low, giving the impression that buyers aren’t really stepping in, so any breakout would probably have little follow-through.
Example 4
The last example. If your watchlist for the day looks like the screenshot below, what does this tell you?
Most stocks are down for the day.
Volume is low throughout.
Conclusion? Sit it out — buyers aren’t really stepping in, even if the stocks turned green later on the day.
To summarise the key takeaway in Dr. Mansi’s own words (20:48):
“If the volumes are not there, the likelihood of follow-through is really, really low.”
So whatever the price action, if you’re trading breakouts, you’ll only get a good risk-to-reward ratio if buyers are stepping into the market — i.e. if the volume is high.
Combining volume with news
This leads nicely into one final nuance, which we’ll start off explaining with an example:
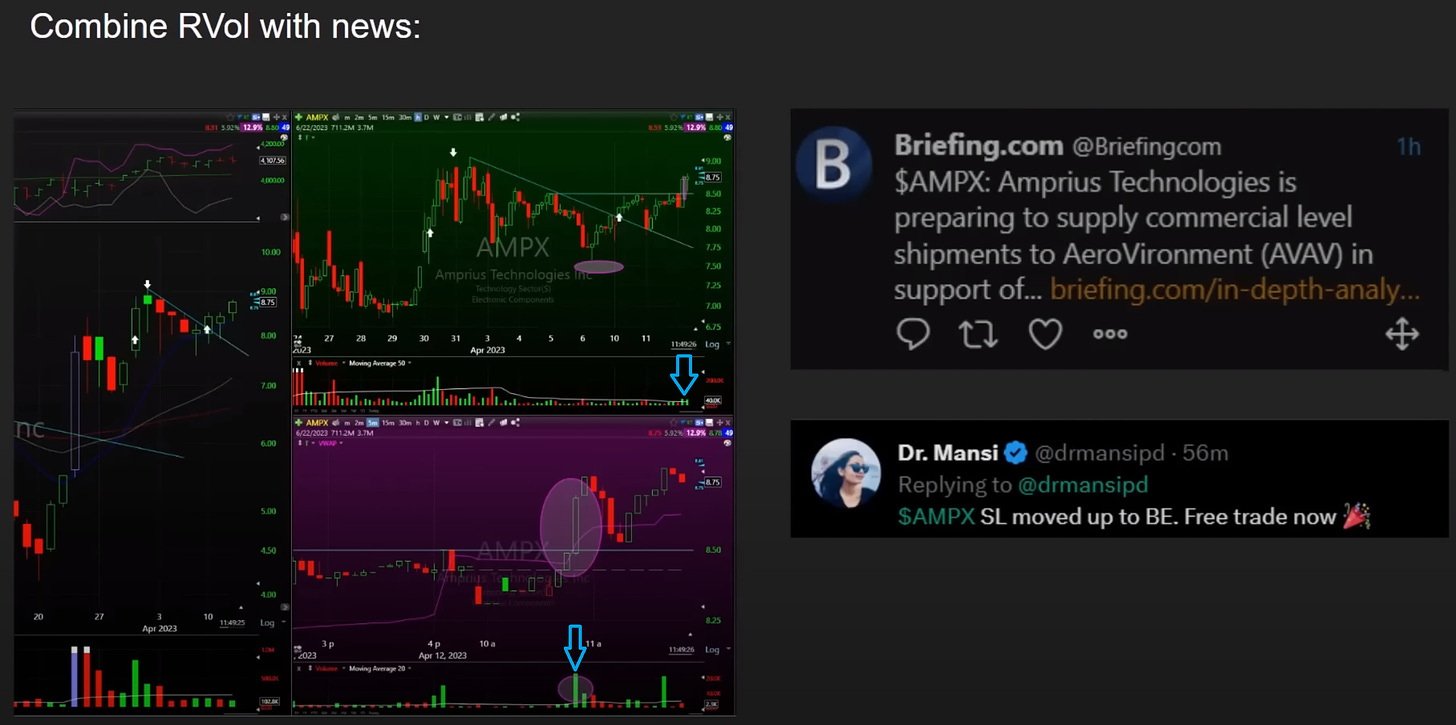
Essentially, on 12 April 2023, Dr. Mansi saw volume coming into $AMPX, which she was already holding, along with a price surge. Upon searching for the ticker on Twitter, she found that it had news — obviously positive news, given the stock’s reaction. Consequently, she moved up her stop to breakeven.
The point is that the combination of good volume and news is a very powerful one. You don’t expect the stock to come back in such a situation. If it does, that suggests that something is wrong, and that you should be exiting the position (stop losses are discussed below).
Situational awareness
To quote Dr. Mansi (24:41):
“So [the] stock going up is good, [relative volume] added to that makes it really good, and then if there’s news behind that [relative volume], that makes it really, really good.”
Of course, there’s more to situational awareness than just reading the volume (and checking the news), but it’s a good start. It’s certainly a practical tool to use in the mornings, when you’re watching multiple stocks and have to make very rapid decisions about what trades, if any, you’re taking.
For those wanting to learn more about situational awareness, and how Dr. Mansi develops hers, she has an in-depth video on the topic that is also part of this video series. My plan is to publish notes on this video too. If that’s something you want me to push up the queue, so to speak, do let me know in the comments below or via X/Twitter!
Stop losses
Stop losses — and stop loss placement — are extremely important. Here are Dr. Mansi’s three non-negotiable rules:
If you’re buying a breakout or pullback, set the stop loss at the LOD. This is a simple rule that enables you to make quick decisions about stop loss placement. The rationale behind this rule is also straightforward: if the breakout works, the LOD should become support and not be taken out. If it is taken out, the breakout has failed and you need to get out of that stock.
Put differently, your original thesis has failed. If the facts change, you need to change your mind too and adapt accordingly — in this case, by closing your position. Such mental flexibility is a critical trait for becoming a successful trader. Be able to admit — quickly — that you were wrong. Interpret the data that is there, not that you want to see.
The stop loss must not exceed the average daily range (ADR) — a volatility indicator that tells you the stock’s average intraday range, over the last 20 trading days, in percentage terms — to maintain a good risk-to-reward ratio. The idea behind this is that if you’re trading a very slow-moving stock with a 1.5% ADR, for example, you shouldn’t be trading it with a 5% stop. Likewise, if you trade a 12% ADR stock with a 2% stop, you’re almost certain to get stopped out — even if the stock is trading normally, thus not doing anything wrong.
Different stocks have different characters; it’s important you account for them in your trading, such as by looking at how the stock trades — how volatile it is (i.e. how high its ADR is), and whether it has a history of making clean, big moves.Dr. Mansi has the stock’s ADR visible just above her daily chart for easy reference while trading. I myself do the same, as does Qullamaggie. In TC2000, the formula for the ADR is: 100*(avg(H/L,20)-1).
The stop loss must not exceed 12%. Why? Losses work geometrically against you — meaning that if you are down 12%, you need a 13.6% gain just to get back to breakeven. If you’re down 20%, you need a 25% gain. If you’re down 50%, you need 100% — a double — just to get back to breakeven!
The bottom line: use maths in your favour. I’ve written about this before in this stack.
And to finish with another practical tip from Dr. Mansi: if you use a spreadsheet to calculate your position sizes and/or plan your trades, have your formula(s) return an error if the required stop loss (based on a technically logical area, such as the LOD) exceeds your hard cut-off point.
A tip of my own
I personally suggest you look at your past trades to find your hard cut-off point. What is your maximum adverse excursion (MAE)? In other words, how far do your winners move against you before turning into winners?
When I first crunched my own numbers, I was shocked to discover that most of my winners were in the 5–7% ADR category, but that not one winner initially moved against me more than 2%. And most winners moved against me far less than that. There’s no doubt a link between that, being most profitable in large caps and being quite risk-averse by nature, especially as a trader. Mentally, I can cope well with low strike rates, but not with big losses. Anyway, since that discovery, I rarely set a >2% stop loss.
To reiterate: I’m not saying you should copy either myself or Dr. Mansi. But take a look at your journal, and see what you own past results tell you! Here I elaborate on some quantitative analysis ideas and techniques that may help you. And I will be posting more stacks like that in future, which go into more detail on specific things you can look at in your journal. They’ll all be available here.
Overall lessons
So, what are my main takeaways from this video by Dr. Mansi?
Know your setups. Know what you are looking for, and what falls outside of your system. If you don’t see your setup (i.e. your edge), you don’t trade. In my opinion, the only real difference between trading and gambling is having an edge — so if I ‘trade’ without one, I’m not actually trading.
Learn to recognise EPs. This is something I didn’t fully appreciate myself until I started reviewing the Qullamaggie streams in serious depth when putting together my public notes, but even if you’re mainly a breakout trader, it’s worthwhile to spend time learning the EP setup — at least so you can recognise them in hindsight, if you don’t actually want to trade them — because the stocks that had one recently, thus recently had a positive catalyst, make for considerably higher-probability breakouts.
I already talked about this earlier, but to reiterate: make sure you don’t just know what resistance areas you want the stock to break through (i.e. where the pivot lines are), but also what entry tactic you’ll use.
Unless dealing with an exceptionally good market, don’t enter right at the open to avoid the retail buying frenzy.
Don’t just look at the market environment the night before, but also at how your watchlist — your universe of stocks — is doing at the open to gauge the likelihood of a breakout working, particularly in terms of relative volume.
To be fair, for me, these are more a matter of reinforcement than actually new information, but nevertheless make for — in my opinion — important lessons. Many of the best traders have only a handful of books/resources that they repeatedly review. As Bruce Lee says:
“I fear not the man who has practiced 10,000 kicks once, but I fear the man who has practiced one kick 10,000 times.”
So why, you may ask, do I look at such a variety of traders? Why not only look at, for example, Qullamaggie’s content and just leave it at that?
Well, because I see the value of hearing the same lessons — especially the same core principles behind those lessons — repeated by different people, who all explain and apply them slightly differently. I think this adds to the depth of my own understanding of those principles, which in turn reinforces them.
More importantly, it contributes to the depth of my understanding of one big lesson in particular: trading isn’t an exact science. What matters is the spirit of the law, not the letter of the law. Since my personality tends towards being too pedantic or perfectionistic, seeing all the different ways that good traders apply the same core principles helps me quell those tendencies while I’m trading. It helps me see that:
In trading, there are only a handful of key rules or principles to follow, like seeking good risk-to-reward ratios.
Beyond that, just do what works for me.
Trading isn’t perfect. It never will be, nor does it need to be. Just find your edge, trade it when you see it and, over time, you’ll make more money than you lose. And as you collect more data, use it to refine your methods.
Thank you for your great videos and tweets, Dr. Mansi! You really are a treasure to the trading community.
Please do follow her on X/Twitter and subscribe to her YouTube channel.
More content like this
This was my first post about Dr. Mansi. If you found it useful, please do like and share it!
Future notes about Dr. Mansi’s videos will all be available here. My full archive is available here. To find out more about me and my Substack, click here.
Let me know what you think!
I’m always looking to improve, so please do share any feedback you might have! Leave a comment below, message me on X/Twitter or send me an email at kayklingson@yahoo.com.






Fantastic note
Great note! Thank you for your work!